
Page 31 - Power of Stem Cells- arthritis and regeneration
P. 31
www.nature.com/scientificreports/
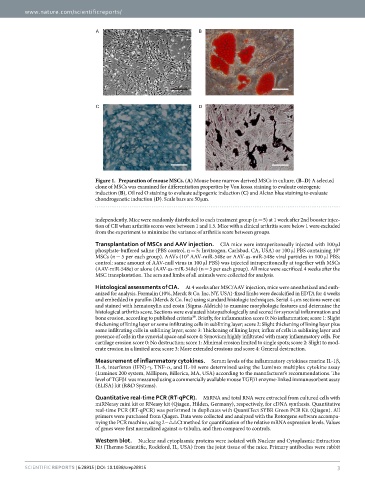
Figure 1. Preparation of mouse MSCs. (A) Mouse bone marrow derived MSCs in culture. (B–D) A selected
clone of MSCs was examined for differentiation properties by Von kossa staining to evaluate osteogenic
induction (B), Oil red O staining to evaluate adipogenic induction (C) and Alcian blue staining to evaluate
chondrogenetic induction (D). Scale bars are 50 μ m.
independently. Mice were randomly distributed to each treatment group (n = 5) at 1 week after 2nd booster injec-
tion of CII when arthritis scores were between 1 and 1.5. Mice with a clinical arthritis score below 1 were excluded
from the experiment to minimize the variance of arthritis score between groups.
Transplantation of MSCs and AAV injection. CIA mice were intraperitoneally injected with 100 μ l
6
phosphate-buffered saline (PBS control, n = 5; Invitrogen, Carlsbad, CA, USA) or 100 μ l PBS containing 10
9
MSCs (n = 5 per each group). AAVs (10 AAV-miR-548e or AAV-as-miR-548e viral particles in 100 μ l PBS;
control: same amount of AAV-null virus in 100 μ l PBS) was injected intraperitoneally at together with MSCs
(AAV-miR-548e) or alone (AAV-as-miR-548e) (n = 5 per each group). All mice were sacrificed 4 weeks after the
MSC transplantation. The sera and limbs of all animals were collected for analysis.
Histological assessments of CIA. At 4 weeks after MSC/AAV injection, mice were anesthetized and euth-
anized for analysis. Formalin (10%, Merck & Co. Inc, NY, USA)-fixed limbs were decalcified in EDTA for 4 weeks
and embedded in paraffin (Merck & Co. Inc) using standard histologic techniques. Serial 4-μ m sections were cut
and stained with hematoxylin and eosin (Sigma-Aldrich) to examine morphologic features and determine the
histological arthritis score. Sections were evaluated histopathologically and scored for synovial inflammation and
39
bone erosion, according to published criteria . Briefly, for inflammation score 0: No inflammation; score 1: Slight
thickening of lining layer or some infiltrating cells in sublining layer; score 2: Slight thickening of lining layer plus
some infiltrating cells in sublining layer; score 3: Thickening of lining layer, influx of cells in sublining layer and
presence of cells in the synovial space and score 4: Synovium highly infiltrated with many inflammatory cells. For
cartilage erosion score 0: No destruction; score 1: Minimal erosion limited to single spots; score 2: Slight to mod-
erate erosion in a limited area; score 3: More extended erosions and score 4: General destruction.
Measurement of inflammatory cytokines. Serum levels of the inflammatory cytokines murine IL-1β ,
IL-6, interferon (IFN)-γ , TNF-α , and IL-10 were determined using the Luminex multiplex cytokine assay
(Luminex 200 system, Millipore, Billerica, MA, USA) according to the manufacturer’s recommendations. The
level of TGFβ 1 was measured using a commercially available mouse TGFβ 1 enzyme-linked immunosorbent assay
(ELISA) kit (R&D Systems).
Quantitative real-time PCR (RT-qPCR). MiRNA and total RNA were extracted from cultured cells with
miRNeasy mini kit or RNeasy kit (Qiagen, Hilden, Germany), respectively, for cDNA synthesis. Quantitative
real-time PCR (RT-qPCR) was performed in duplicates with QuantiTect SYBR Green PCR Kit (Qiagen). All
primers were purchased from Qiagen. Data were collected and analyzed with the Rotorgene software accompa-
nying the PCR machine, using 2− △ △ Ct method for quantification of the relative mRNA expression levels. Values
of genes were first normalized against α -tubulin, and then compared to controls.
Western blot. Nuclear and cytoplasmic proteins were isolated with Nuclear and Cytoplasmic Extraction
Kit (Thermo Scientific, Rockford, IL, USA) from the joint tissue of the mice. Primary antibodies were rabbit
Scientific RepoRts | 6:28915 | DOI: 10.1038/srep28915 3