
Page 92 - EXOSOMES
P. 92
1428 uMSC Exosomes Suppress Scar Formation
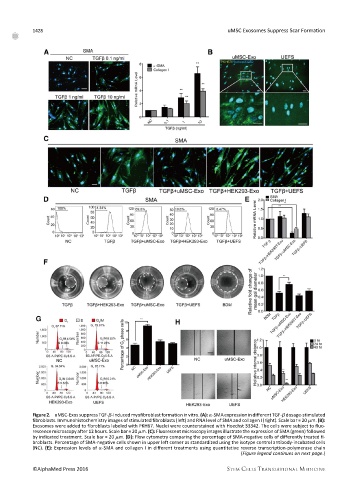
Figure2. uMSC-Exos suppressTGF-b-induced myofibroblastformationin vitro.(A): a-SMAexpressionindifferentTGF-bdosage-stimulated
fibroblasts. Immunohistochemistry images of stimulated fibroblasts (left) and RNA level of SMA and collagen I (right). Scale bar = 20 mm. (B):
Exosomes were added to fibroblasts labeled with PKH67. Nuclei were counterstained with Hoechst 33342. The cells were subject to fluo-
rescence microscopy after 12 hours. Scale bar = 20 mm. (C): Fluorescent microscopy images illustrate the expression of SMA (green) followed
by indicated treatment. Scale bar = 20 mm. (D): Flow cytometry comparing the percentage of SMA-negative cells of differently treated fi-
broblasts. Percentage of SMA-negative cells shown in upper left corner as standardized using the isotype control antibody-incubated cells
(NC). (E): Expression levels of a-SMA and collagen I in different treatments using quantitative reverse transcription-polymerase chain
(Figure legend continues on next page.)
©AlphaMed Press 2016 STEM CELLS TRANSLATIONAL MEDICINE