
Page 37 - Noble's TMT Consumer Virtual Equity Conference 2024
P. 37
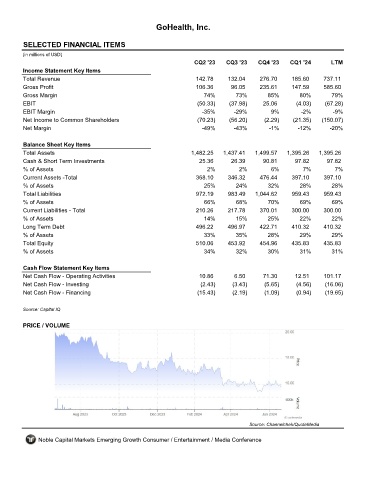
GoHealth, Inc.


         SELECTED FINANCIAL ITEMS                                 GOCO
         (in millions of USD)
                                                                     CQ2 '23    CQ3 '23    CQ4 '23    CQ1 '24       LTM
         Income Statement Key Items
         Total Revenue                                               142.78     132.04     276.70      185.60     737.11
         Gross Profit                                                106.36      96.05     235.61      147.59     585.60
         Gross Margin                                                   74%        73%        85%        80%        79%
         EBIT                                                         (50.33)    (37.98)     25.06      (4.03)    (67.28)
         EBIT Margin                                                   -35%       -29%         9%         -2%        -9%
         Net Income to Common Shareholders                            (70.23)    (56.20)     (2.29)    (21.35)   (150.07)
         Net Margin                                                    -49%       -43%         -1%       -12%       -20%

         Balance Sheet Key Items
         Total Assets                                               1,482.25   1,437.41   1,499.57   1,395.26   1,395.26
         Cash & Short Term Investments                                25.36      26.39       90.81      97.82      97.82
         % of Assets                                                     2%         2%         6%          7%         7%
         Current Assets -Total                                       368.10     346.32      476.44     397.10     397.10
         % of Assets                                                    25%        24%        32%        28%         28%
         Total Liabilities                                           972.19     983.49    1,044.62     959.43     959.43
         % of Assets                                                    66%        68%        70%        69%         69%
         Current Liabilities - Total                                 210.26     217.78     370.01      300.00     300.00
         % of Assets                                                    14%        15%        25%        22%        22%
         Long Term Debt                                              496.22     496.97     422.71      410.32     410.32
         % of Assets                                                    33%        35%        28%        29%        29%
         Total Equity                                                510.06     453.92     454.96      435.83     435.83
         % of Assets                                                    34%        32%        30%        31%        31%

         Cash Flow Statement Key Items
         Net Cash Flow - Operating Activities                         10.86        6.50      71.30      12.51     101.17
         Net Cash Flow - Investing                                     (2.43)     (3.43)     (5.65)     (4.56)    (16.06)
         Net Cash Flow - Financing                                    (15.43)     (2.19)     (1.09)     (0.94)    (19.65)

         Source: Capital IQ


         PRICE / VOLUME


                                                                                        Source: Channelchek/QuoteMedia

              Noble Capital Markets Emerging Growth Consumer / Entertainment / Media Conference