
Page 45 - Noble's TMT Consumer Virtual Equity Conference 2024
P. 45
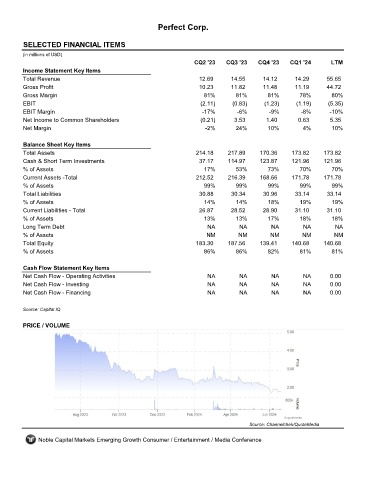
Perfect Corp.


         SELECTED FINANCIAL ITEMS                                 PERF
         (in millions of USD)
                                                                     CQ2 '23    CQ3 '23    CQ4 '23    CQ1 '24       LTM
         Income Statement Key Items
         Total Revenue                                                12.69      14.55       14.12      14.29      55.65
         Gross Profit                                                 10.23      11.82       11.48      11.19      44.72
         Gross Margin                                                   81%        81%        81%        78%        80%
         EBIT                                                          (2.11)     (0.83)     (1.23)     (1.19)     (5.35)
         EBIT Margin                                                   -17%         -6%        -9%        -8%       -10%
         Net Income to Common Shareholders                             (0.21)      3.53       1.40       0.63       5.35
         Net Margin                                                     -2%        24%        10%         4%         10%

         Balance Sheet Key Items
         Total Assets                                                214.18     217.89     170.36      173.82     173.82
         Cash & Short Term Investments                                37.17     114.97     123.87      121.96     121.96
         % of Assets                                                    17%        53%        73%        70%         70%
         Current Assets -Total                                       212.52     216.39      168.66     171.78     171.78
         % of Assets                                                    99%        99%        99%        99%         99%
         Total Liabilities                                            30.88       30.34      30.96      33.14      33.14
         % of Assets                                                    14%        14%        18%        19%         19%
         Current Liabilities - Total                                  26.87      28.52       28.90      31.10      31.10
         % of Assets                                                    13%        13%        17%        18%        18%
         Long Term Debt                                                  NA         NA         NA          NA         NA
         % of Assets                                                     NM         NM         NM         NM         NM
         Total Equity                                                183.30     187.56     139.41      140.68     140.68
         % of Assets                                                    86%        86%        82%        81%        81%

         Cash Flow Statement Key Items
         Net Cash Flow - Operating Activities                            NA         NA         NA          NA       0.00
         Net Cash Flow - Investing                                       NA         NA         NA          NA       0.00
         Net Cash Flow - Financing                                       NA         NA         NA          NA       0.00

         Source: Capital IQ


         PRICE / VOLUME


                                                                                        Source: Channelchek/QuoteMedia

              Noble Capital Markets Emerging Growth Consumer / Entertainment / Media Conference