Page 43 - Noble's TMT Consumer Virtual Equity Conference 2024
P. 43

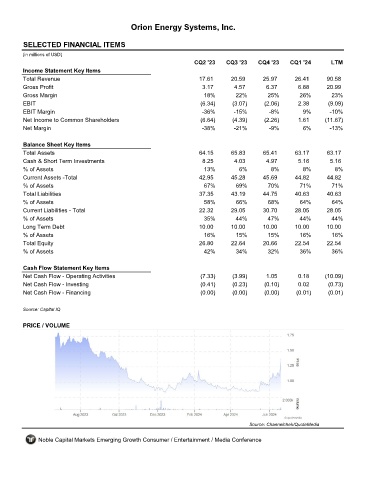
Orion Energy Systems, Inc.


         SELECTED FINANCIAL ITEMS                                 OESX
         (in millions of USD)
                                                                     CQ2 '23    CQ3 '23    CQ4 '23    CQ1 '24       LTM
         Income Statement Key Items
         Total Revenue                                                17.61      20.59       25.97      26.41      90.58
         Gross Profit                                                  3.17        4.57       6.37       6.88      20.99
         Gross Margin                                                   18%        22%        25%        26%        23%
         EBIT                                                          (6.34)     (3.07)     (2.06)      2.38      (9.09)
         EBIT Margin                                                   -36%       -15%         -8%        9%        -10%
         Net Income to Common Shareholders                             (6.64)     (4.39)     (2.26)      1.61     (11.67)
         Net Margin                                                    -38%       -21%         -9%        6%        -13%

         Balance Sheet Key Items
         Total Assets                                                 64.15      65.83       65.41      63.17      63.17
         Cash & Short Term Investments                                 8.25        4.03       4.97       5.16       5.16
         % of Assets                                                    13%         6%         8%          8%         8%
         Current Assets -Total                                        42.95      45.28       45.69      44.82      44.82
         % of Assets                                                    67%        69%        70%        71%         71%
         Total Liabilities                                            37.35       43.19      44.75      40.63      40.63
         % of Assets                                                    58%        66%        68%        64%         64%
         Current Liabilities - Total                                  22.32      29.05       30.70      28.05      28.05
         % of Assets                                                    35%        44%        47%        44%        44%
         Long Term Debt                                               10.00      10.00       10.00      10.00      10.00
         % of Assets                                                    16%        15%        15%        16%        16%
         Total Equity                                                 26.80      22.64       20.66      22.54      22.54
         % of Assets                                                    42%        34%        32%        36%        36%

         Cash Flow Statement Key Items
         Net Cash Flow - Operating Activities                          (7.33)     (3.99)      1.05       0.18     (10.09)
         Net Cash Flow - Investing                                     (0.41)     (0.23)     (0.10)      0.02      (0.73)
         Net Cash Flow - Financing                                     (0.00)     (0.00)     (0.00)     (0.01)     (0.01)

         Source: Capital IQ


         PRICE / VOLUME


                                                                                        Source: Channelchek/QuoteMedia

              Noble Capital Markets Emerging Growth Consumer / Entertainment / Media Conference
   38   39   40   41   42   43   44   45   46   47   48