Page 13 - C:\Users\Chris Patches\My ShareSync\Virtual Events\2024 - TMT Consumer\Book\Flip Output\
P. 13

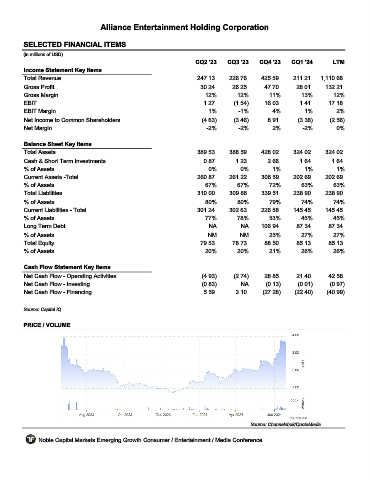
Alliance Entertainment Holding Corporation


         SELECTED FINANCIAL ITEMS                                 AENT
         (in millions of USD)
                                                                     CQ2 '23    CQ3 '23    CQ4 '23    CQ1 '24       LTM
         Income Statement Key Items
         Total Revenue                                               247.13     226.76     425.59      211.21   1,110.68
         Gross Profit                                                 30.24      26.25       47.70      28.01     132.21
         Gross Margin                                                   12%        12%        11%        13%        12%
         EBIT                                                          1.27       (1.54)     16.03       1.41      17.18
         EBIT Margin                                                     1%         -1%        4%         1%          2%
         Net Income to Common Shareholders                             (4.63)     (3.46)      8.91      (3.38)     (2.56)
         Net Margin                                                     -2%         -2%        2%         -2%         0%

         Balance Sheet Key Items
         Total Assets                                                389.53     388.59     428.02      324.02     324.02
         Cash & Short Term Investments                                 0.87        1.23       2.66       1.64       1.64
         % of Assets                                                     0%         0%         1%          1%         1%
         Current Assets -Total                                       260.87     261.22     306.59      202.69     202.69
         % of Assets                                                    67%        67%        72%        63%         63%
         Total Liabilities                                           310.00     309.86      339.51     238.90     238.90
         % of Assets                                                    80%        80%        79%        74%         74%
         Current Liabilities - Total                                 301.24     302.63     226.58      145.45     145.45
         % of Assets                                                    77%        78%        53%        45%        45%
         Long Term Debt                                                  NA         NA     106.94       87.34      87.34
         % of Assets                                                     NM         NM        25%        27%        27%
         Total Equity                                                 79.53      78.73       88.50      85.13      85.13
         % of Assets                                                    20%        20%        21%        26%        26%

         Cash Flow Statement Key Items
         Net Cash Flow - Operating Activities                          (4.93)     (2.74)     28.85      21.40      42.58
         Net Cash Flow - Investing                                     (0.83)       NA       (0.13)     (0.01)     (0.97)
         Net Cash Flow - Financing                                     5.59        3.10     (27.28)    (22.40)    (40.99)

         Source: Capital IQ


         PRICE / VOLUME


                                                                                        Source: Channelchek/QuoteMedia

              Noble Capital Markets Emerging Growth Consumer / Entertainment / Media Conference
   8   9   10   11   12   13   14   15   16   17   18