Page 23 - C:\Users\Chris Patches\My ShareSync\Virtual Events\2024 - TMT Consumer\Book\Flip Output\
P. 23

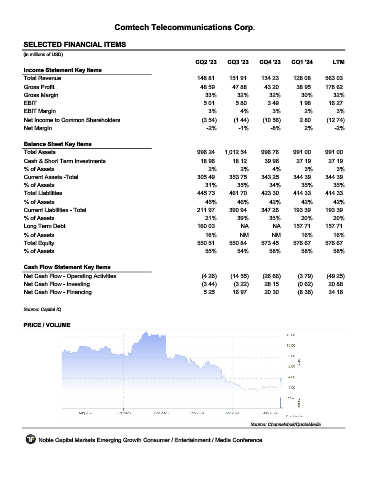
Comtech Telecommunications Corp.


         SELECTED FINANCIAL ITEMS                                 CMTL
         (in millions of USD)
                                                                     CQ2 '23    CQ3 '23    CQ4 '23    CQ1 '24       LTM
         Income Statement Key Items
         Total Revenue                                               148.81     151.91     134.23      128.08     563.03
         Gross Profit                                                 48.59      47.88       43.20      38.95     178.62
         Gross Margin                                                   33%        32%        32%        30%        32%
         EBIT                                                          5.01        5.80       3.49       1.98      16.27
         EBIT Margin                                                     3%         4%         3%         2%          3%
         Net Income to Common Shareholders                             (3.54)     (1.44)    (10.56)      2.80     (12.74)
         Net Margin                                                     -2%         -1%        -8%        2%         -2%

         Balance Sheet Key Items
         Total Assets                                                996.24    1,012.54    996.76      991.00     991.00
         Cash & Short Term Investments                                18.96      18.12       39.96      27.19      27.19
         % of Assets                                                     2%         2%         4%          3%         3%
         Current Assets -Total                                       305.49     353.75      343.25     344.39     344.39
         % of Assets                                                    31%        35%        34%        35%         35%
         Total Liabilities                                           445.73     461.70      423.30     414.33     414.33
         % of Assets                                                    45%        46%        42%        42%         42%
         Current Liabilities - Total                                 211.97     390.94     347.26      193.39     193.39
         % of Assets                                                    21%        39%        35%        20%        20%
         Long Term Debt                                              160.03         NA         NA      157.71     157.71
         % of Assets                                                    16%         NM         NM        16%        16%
         Total Equity                                                550.51     550.84     573.45      576.67     576.67
         % of Assets                                                    55%        54%        58%        58%        58%

         Cash Flow Statement Key Items
         Net Cash Flow - Operating Activities                          (4.26)    (14.55)    (26.66)     (3.79)    (49.25)
         Net Cash Flow - Investing                                     (3.44)     (3.22)     28.15      (0.62)     20.88
         Net Cash Flow - Financing                                     5.25      16.97       20.30      (8.36)     34.16

         Source: Capital IQ


         PRICE / VOLUME


                                                                                        Source: Channelchek/QuoteMedia

              Noble Capital Markets Emerging Growth Consumer / Entertainment / Media Conference
   18   19   20   21   22   23   24   25   26   27   28