Page 125 - NobleCon21
P. 125

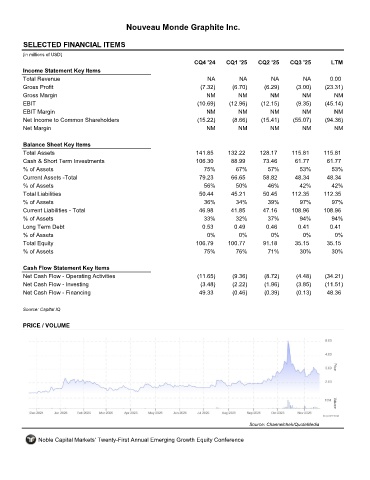
Nouveau Monde Graphite Inc.


         SELECTED FINANCIAL ITEMS                                 TSX:NOU
         (in millions of USD)
                                                                     CQ4 '24    CQ1 '25    CQ2 '25    CQ3 '25       LTM
         Income Statement Key Items
         Total Revenue                                                   NA         NA         NA          NA       0.00
         Gross Profit                                                  (7.32)     (6.70)     (6.29)     (3.00)    (23.31)
         Gross Margin                                                    NM         NM         NM         NM         NM
         EBIT                                                         (10.69)    (12.96)    (12.15)     (9.35)    (45.14)
         EBIT Margin                                                     NM         NM         NM         NM         NM
         Net Income to Common Shareholders                            (15.22)     (8.66)    (15.41)    (55.07)    (94.36)
         Net Margin                                                      NM         NM         NM         NM         NM

         Balance Sheet Key Items
         Total Assets                                                141.85     132.22     128.17      115.81     115.81
         Cash & Short Term Investments                               106.30      88.99       73.46      61.77      61.77
         % of Assets                                                    75%        67%        57%        53%         53%
         Current Assets -Total                                        79.23      66.65       58.82      48.34      48.34
         % of Assets                                                    56%        50%        46%        42%         42%
         Total Liabilities                                            50.44       45.21      50.45     112.35     112.35
         % of Assets                                                    36%        34%        39%        97%         97%
         Current Liabilities - Total                                  46.98      41.85       47.16     108.96     108.96
         % of Assets                                                    33%        32%        37%        94%        94%
         Long Term Debt                                                0.53        0.49       0.46       0.41       0.41
         % of Assets                                                     0%         0%         0%         0%          0%
         Total Equity                                                106.79     100.77       91.18      35.15      35.15
         % of Assets                                                    75%        76%        71%        30%        30%

         Cash Flow Statement Key Items
         Net Cash Flow - Operating Activities                         (11.65)     (9.36)     (8.72)     (4.48)    (34.21)
         Net Cash Flow - Investing                                     (3.48)     (2.22)     (1.96)     (3.85)    (11.51)
         Net Cash Flow - Financing                                    49.33       (0.46)     (0.39)     (0.13)     48.36

         Source: Capital IQ


         PRICE / VOLUME


                                                                                        Source: Channelchek/QuoteMedia

              Noble Capital Markets' Twenty-First Annual Emerging Growth Equity Conference
   120   121   122   123   124   125   126   127   128   129   130