Page 129 - NobleCon21
P. 129

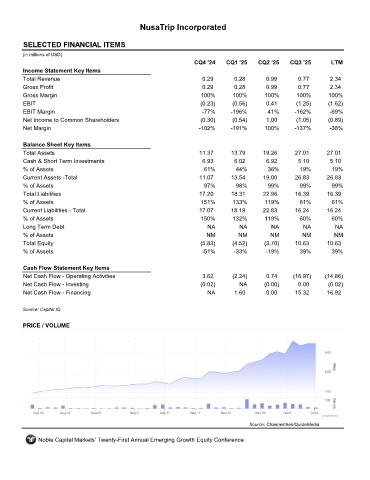
NusaTrip Incorporated


         SELECTED FINANCIAL ITEMS                                 NUTR
         (in millions of USD)
                                                                     CQ4 '24    CQ1 '25    CQ2 '25    CQ3 '25       LTM
         Income Statement Key Items
         Total Revenue                                                 0.29        0.28       0.99       0.77       2.34
         Gross Profit                                                  0.29        0.28       0.99       0.77       2.34
         Gross Margin                                                  100%       100%       100%       100%       100%
         EBIT                                                          (0.23)     (0.56)      0.41      (1.25)     (1.62)
         EBIT Margin                                                   -77%      -196%        41%       -162%       -69%
         Net Income to Common Shareholders                             (0.30)     (0.54)      1.00      (1.05)     (0.89)
         Net Margin                                                   -102%      -191%       100%       -137%       -38%

         Balance Sheet Key Items
         Total Assets                                                 11.37      13.79       19.26      27.01      27.01
         Cash & Short Term Investments                                 6.93        6.02       6.92       5.10       5.10
         % of Assets                                                    61%        44%        36%        19%         19%
         Current Assets -Total                                        11.07      13.54       19.00      26.83      26.83
         % of Assets                                                    97%        98%        99%        99%         99%
         Total Liabilities                                            17.20      18.31       22.96      16.39      16.39
         % of Assets                                                   151%       133%       119%        61%         61%
         Current Liabilities - Total                                  17.07      18.19       22.83      16.24      16.24
         % of Assets                                                   150%       132%       119%        60%        60%
         Long Term Debt                                                  NA         NA         NA          NA         NA
         % of Assets                                                     NM         NM         NM         NM         NM
         Total Equity                                                  (5.83)     (4.52)     (3.70)     10.63      10.63
         % of Assets                                                   -51%       -33%        -19%       39%        39%

         Cash Flow Statement Key Items
         Net Cash Flow - Operating Activities                          3.62       (2.24)      0.74     (16.97)    (14.86)
         Net Cash Flow - Investing                                     (0.02)       NA       (0.00)      0.00      (0.02)
         Net Cash Flow - Financing                                       NA        1.60       0.00      15.32      16.92

         Source: Capital IQ


         PRICE / VOLUME


                                                                                        Source: Channelchek/QuoteMedia

              Noble Capital Markets' Twenty-First Annual Emerging Growth Equity Conference
   124   125   126   127   128   129   130   131   132   133   134