
Page 133 - NobleCon21
P. 133
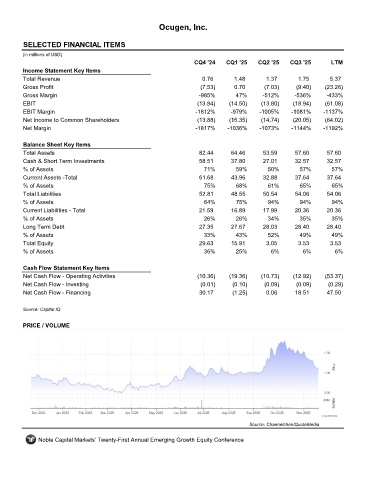
Ocugen, Inc.


         SELECTED FINANCIAL ITEMS                                 OCGN
         (in millions of USD)
                                                                     CQ4 '24    CQ1 '25    CQ2 '25    CQ3 '25       LTM
         Income Statement Key Items
         Total Revenue                                                 0.76        1.48       1.37       1.75       5.37
         Gross Profit                                                  (7.53)      0.70      (7.03)     (9.40)    (23.26)
         Gross Margin                                                 -985%        47%      -512%       -536%      -433%
         EBIT                                                         (13.84)    (14.50)    (13.80)    (18.94)    (61.08)
         EBIT Margin                                                 -1812%      -979%     -1005%     -1081%      -1137%
         Net Income to Common Shareholders                            (13.88)    (15.35)    (14.74)    (20.05)    (64.02)
         Net Margin                                                  -1817%     -1036%     -1073%     -1144%      -1192%

         Balance Sheet Key Items
         Total Assets                                                 82.44      64.46       53.59      57.60      57.60
         Cash & Short Term Investments                                58.51      37.80       27.01      32.57      32.57
         % of Assets                                                    71%        59%        50%        57%         57%
         Current Assets -Total                                        61.68      43.96       32.88      37.64      37.64
         % of Assets                                                    75%        68%        61%        65%         65%
         Total Liabilities                                            52.81       48.55      50.54      54.06      54.06
         % of Assets                                                    64%        75%        94%        94%         94%
         Current Liabilities - Total                                  21.59      16.89       17.99      20.36      20.36
         % of Assets                                                    26%        26%        34%        35%        35%
         Long Term Debt                                               27.35      27.67       28.03      28.40      28.40
         % of Assets                                                    33%        43%        52%        49%        49%
         Total Equity                                                 29.63      15.91        3.05       3.53       3.53
         % of Assets                                                    36%        25%         6%         6%          6%

         Cash Flow Statement Key Items
         Net Cash Flow - Operating Activities                         (10.36)    (19.36)    (10.73)    (12.92)    (53.37)
         Net Cash Flow - Investing                                     (0.01)     (0.10)     (0.09)     (0.09)     (0.29)
         Net Cash Flow - Financing                                    30.17       (1.25)      0.06      18.51      47.50

         Source: Capital IQ


         PRICE / VOLUME


                                                                                        Source: Channelchek/QuoteMedia

              Noble Capital Markets' Twenty-First Annual Emerging Growth Equity Conference