
Page 135 - NobleCon21
P. 135
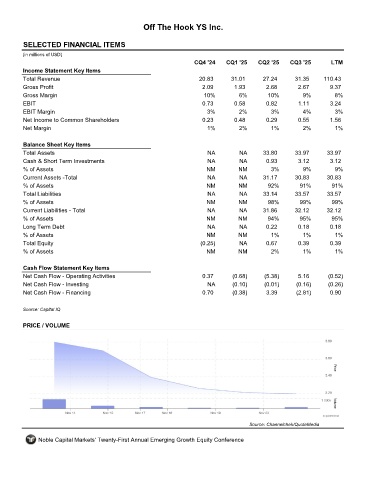
Off The Hook YS Inc.


         SELECTED FINANCIAL ITEMS                                 OTH
         (in millions of USD)
                                                                     CQ4 '24    CQ1 '25    CQ2 '25    CQ3 '25       LTM
         Income Statement Key Items
         Total Revenue                                                20.83      31.01       27.24      31.35     110.43
         Gross Profit                                                  2.09        1.93       2.68       2.67       9.37
         Gross Margin                                                   10%         6%        10%         9%          8%
         EBIT                                                          0.73        0.58       0.82       1.11       3.24
         EBIT Margin                                                     3%         2%         3%         4%          3%
         Net Income to Common Shareholders                             0.23        0.48       0.29       0.55       1.56
         Net Margin                                                      1%         2%         1%         2%          1%

         Balance Sheet Key Items
         Total Assets                                                    NA         NA       33.80      33.97      33.97
         Cash & Short Term Investments                                   NA         NA        0.93       3.12       3.12
         % of Assets                                                     NM         NM         3%          9%         9%
         Current Assets -Total                                           NA         NA       31.17      30.83      30.83
         % of Assets                                                     NM         NM        92%        91%         91%
         Total Liabilities                                               NA         NA       33.14      33.57      33.57
         % of Assets                                                     NM         NM        98%        99%         99%
         Current Liabilities - Total                                     NA         NA       31.86      32.12      32.12
         % of Assets                                                     NM         NM        94%        95%        95%
         Long Term Debt                                                  NA         NA        0.22       0.18       0.18
         % of Assets                                                     NM         NM         1%         1%          1%
         Total Equity                                                  (0.25)       NA        0.67       0.39       0.39
         % of Assets                                                     NM         NM         2%         1%          1%

         Cash Flow Statement Key Items
         Net Cash Flow - Operating Activities                          0.37       (0.68)     (5.38)      5.16      (0.52)
         Net Cash Flow - Investing                                       NA       (0.10)     (0.01)     (0.16)     (0.26)
         Net Cash Flow - Financing                                     0.70       (0.38)      3.39      (2.81)      0.90

         Source: Capital IQ


         PRICE / VOLUME


                                                                                        Source: Channelchek/QuoteMedia

              Noble Capital Markets' Twenty-First Annual Emerging Growth Equity Conference