
Page 137 - NobleCon21
P. 137
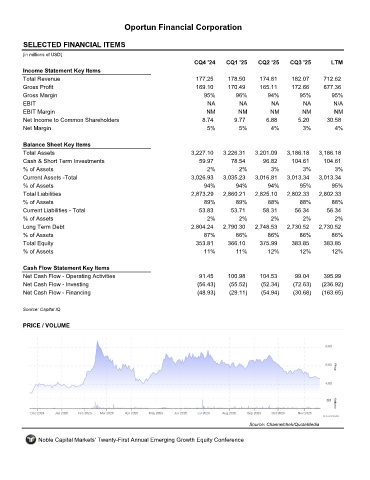
Oportun Financial Corporation


         SELECTED FINANCIAL ITEMS                                 OPRT
         (in millions of USD)
                                                                     CQ4 '24    CQ1 '25    CQ2 '25    CQ3 '25       LTM
         Income Statement Key Items
         Total Revenue                                               177.25     178.50     174.81      182.07     712.62
         Gross Profit                                                169.10     170.49     165.11      172.66     677.36
         Gross Margin                                                   95%        96%        94%        95%        95%
         EBIT                                                            NA         NA         NA          NA        N/A
         EBIT Margin                                                     NM         NM         NM         NM         NM
         Net Income to Common Shareholders                             8.74        9.77       6.88       5.20      30.58
         Net Margin                                                      5%         5%         4%         3%          4%

         Balance Sheet Key Items
         Total Assets                                               3,227.10   3,226.31   3,201.09   3,186.18   3,186.18
         Cash & Short Term Investments                                59.97      78.54       96.82     104.61     104.61
         % of Assets                                                     2%         2%         3%          3%         3%
         Current Assets -Total                                      3,026.93   3,035.23   3,016.81   3,013.34   3,013.34
         % of Assets                                                    94%        94%        94%        95%         95%
         Total Liabilities                                          2,873.29   2,860.21   2,825.10   2,802.33   2,802.33
         % of Assets                                                    89%        89%        88%        88%         88%
         Current Liabilities - Total                                  53.83      53.71       58.31      56.34      56.34
         % of Assets                                                     2%         2%         2%         2%          2%
         Long Term Debt                                             2,804.24   2,790.30   2,748.53   2,730.52   2,730.52
         % of Assets                                                    87%        86%        86%        86%        86%
         Total Equity                                                353.81     366.10     375.99      383.85     383.85
         % of Assets                                                    11%        11%        12%        12%        12%

         Cash Flow Statement Key Items
         Net Cash Flow - Operating Activities                         91.45     100.98     104.53       99.04     395.99
         Net Cash Flow - Investing                                    (56.43)    (55.52)    (52.34)    (72.63)   (236.92)
         Net Cash Flow - Financing                                    (48.93)    (29.11)    (54.94)    (30.68)   (163.65)

         Source: Capital IQ


         PRICE / VOLUME


                                                                                        Source: Channelchek/QuoteMedia

              Noble Capital Markets' Twenty-First Annual Emerging Growth Equity Conference