
Page 141 - NobleCon21
P. 141
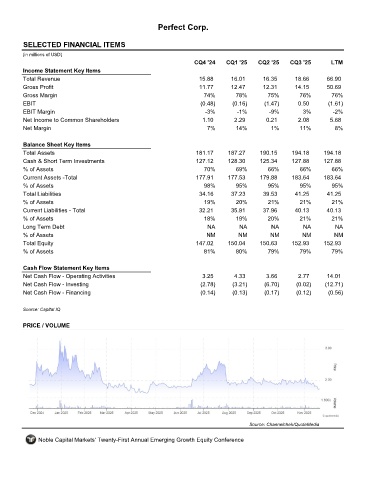
Perfect Corp.


         SELECTED FINANCIAL ITEMS                                 PERF
         (in millions of USD)
                                                                     CQ4 '24    CQ1 '25    CQ2 '25    CQ3 '25       LTM
         Income Statement Key Items
         Total Revenue                                                15.88      16.01       16.35      18.66      66.90
         Gross Profit                                                 11.77      12.47       12.31      14.15      50.69
         Gross Margin                                                   74%        78%        75%        76%        76%
         EBIT                                                          (0.48)     (0.16)     (1.47)      0.50      (1.61)
         EBIT Margin                                                    -3%         -1%        -9%        3%         -2%
         Net Income to Common Shareholders                             1.10        2.29       0.21       2.08       5.68
         Net Margin                                                      7%        14%         1%        11%          8%

         Balance Sheet Key Items
         Total Assets                                                181.17     187.27     190.15      194.18     194.18
         Cash & Short Term Investments                               127.12     128.30     125.34      127.88     127.88
         % of Assets                                                    70%        69%        66%        66%         66%
         Current Assets -Total                                       177.91     177.53      179.88     183.64     183.64
         % of Assets                                                    98%        95%        95%        95%         95%
         Total Liabilities                                            34.16       37.23      39.53      41.25      41.25
         % of Assets                                                    19%        20%        21%        21%         21%
         Current Liabilities - Total                                  32.21      35.91       37.96      40.13      40.13
         % of Assets                                                    18%        19%        20%        21%        21%
         Long Term Debt                                                  NA         NA         NA          NA         NA
         % of Assets                                                     NM         NM         NM         NM         NM
         Total Equity                                                147.02     150.04     150.63      152.93     152.93
         % of Assets                                                    81%        80%        79%        79%        79%

         Cash Flow Statement Key Items
         Net Cash Flow - Operating Activities                          3.25        4.33       3.66       2.77      14.01
         Net Cash Flow - Investing                                     (2.78)     (3.21)     (6.70)     (0.02)    (12.71)
         Net Cash Flow - Financing                                     (0.14)     (0.13)     (0.17)     (0.12)     (0.56)

         Source: Capital IQ


         PRICE / VOLUME


                                                                                        Source: Channelchek/QuoteMedia

              Noble Capital Markets' Twenty-First Annual Emerging Growth Equity Conference