
Page 155 - NobleCon21
P. 155
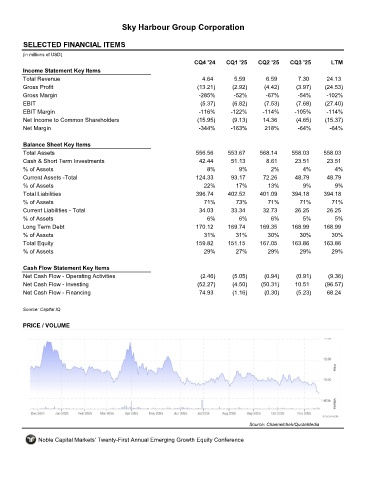
Sky Harbour Group Corporation


         SELECTED FINANCIAL ITEMS                                 SKYH
         (in millions of USD)
                                                                     CQ4 '24    CQ1 '25    CQ2 '25    CQ3 '25       LTM
         Income Statement Key Items
         Total Revenue                                                 4.64        5.59       6.59       7.30      24.13
         Gross Profit                                                 (13.21)     (2.92)     (4.42)     (3.97)    (24.53)
         Gross Margin                                                 -285%       -52%        -67%       -54%      -102%
         EBIT                                                          (5.37)     (6.82)     (7.53)     (7.68)    (27.40)
         EBIT Margin                                                  -116%      -122%      -114%       -105%      -114%
         Net Income to Common Shareholders                            (15.95)     (9.13)     14.36      (4.65)    (15.37)
         Net Margin                                                   -344%      -163%       218%        -64%       -64%

         Balance Sheet Key Items
         Total Assets                                                556.56     553.67     568.14      558.03     558.03
         Cash & Short Term Investments                                42.44      51.13        8.61      23.51      23.51
         % of Assets                                                     8%         9%         2%          4%         4%
         Current Assets -Total                                       124.33      93.17       72.26      48.79      48.79
         % of Assets                                                    22%        17%        13%          9%         9%
         Total Liabilities                                           396.74     402.52      401.09     394.18     394.18
         % of Assets                                                    71%        73%        71%        71%         71%
         Current Liabilities - Total                                  34.03      33.34       32.73      26.25      26.25
         % of Assets                                                     6%         6%         6%         5%          5%
         Long Term Debt                                              170.12     169.74     169.35      168.99     168.99
         % of Assets                                                    31%        31%        30%        30%        30%
         Total Equity                                                159.82     151.15     167.05      163.86     163.86
         % of Assets                                                    29%        27%        29%        29%        29%

         Cash Flow Statement Key Items
         Net Cash Flow - Operating Activities                          (2.46)     (5.05)     (0.94)     (0.91)     (9.36)
         Net Cash Flow - Investing                                    (52.27)     (4.50)    (50.31)     10.51     (96.57)
         Net Cash Flow - Financing                                    74.93       (1.16)     (0.30)     (5.23)     68.24

         Source: Capital IQ


         PRICE / VOLUME


                                                                                        Source: Channelchek/QuoteMedia

              Noble Capital Markets' Twenty-First Annual Emerging Growth Equity Conference