Page 157 - NobleCon21
P. 157

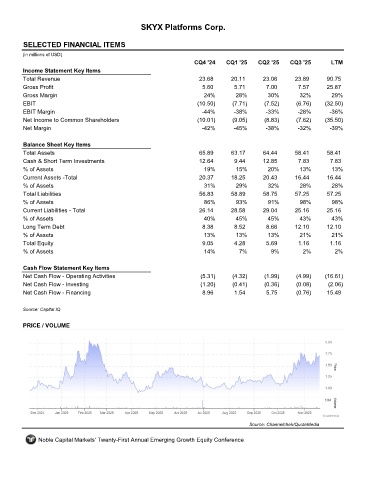
SKYX Platforms Corp.


         SELECTED FINANCIAL ITEMS                                 SKYX
         (in millions of USD)
                                                                     CQ4 '24    CQ1 '25    CQ2 '25    CQ3 '25       LTM
         Income Statement Key Items
         Total Revenue                                                23.68      20.11       23.06      23.89      90.75
         Gross Profit                                                  5.60        5.71       7.00       7.57      25.87
         Gross Margin                                                   24%        28%        30%        32%        29%
         EBIT                                                         (10.50)     (7.71)     (7.52)     (6.76)    (32.50)
         EBIT Margin                                                   -44%       -38%        -33%       -28%       -36%
         Net Income to Common Shareholders                            (10.01)     (9.05)     (8.83)     (7.62)    (35.50)
         Net Margin                                                    -42%       -45%        -38%       -32%       -39%

         Balance Sheet Key Items
         Total Assets                                                 65.89      63.17       64.44      58.41      58.41
         Cash & Short Term Investments                                12.64        9.44      12.85       7.83       7.83
         % of Assets                                                    19%        15%        20%        13%         13%
         Current Assets -Total                                        20.37      18.25       20.43      16.44      16.44
         % of Assets                                                    31%        29%        32%        28%         28%
         Total Liabilities                                            56.83       58.89      58.75      57.25      57.25
         % of Assets                                                    86%        93%        91%        98%         98%
         Current Liabilities - Total                                  26.14      28.58       29.04      25.16      25.16
         % of Assets                                                    40%        45%        45%        43%        43%
         Long Term Debt                                                8.38        8.52       8.66      12.10      12.10
         % of Assets                                                    13%        13%        13%        21%        21%
         Total Equity                                                  9.05        4.28       5.69       1.16       1.16
         % of Assets                                                    14%         7%         9%         2%          2%

         Cash Flow Statement Key Items
         Net Cash Flow - Operating Activities                          (5.31)     (4.32)     (1.99)     (4.99)    (16.61)
         Net Cash Flow - Investing                                     (1.20)     (0.41)     (0.36)     (0.08)     (2.06)
         Net Cash Flow - Financing                                     8.96        1.54       5.75      (0.76)     15.49

         Source: Capital IQ


         PRICE / VOLUME


                                                                                        Source: Channelchek/QuoteMedia

              Noble Capital Markets' Twenty-First Annual Emerging Growth Equity Conference
   152   153   154   155   156   157   158   159   160   161   162