Page 89 - NobleCon21
P. 89

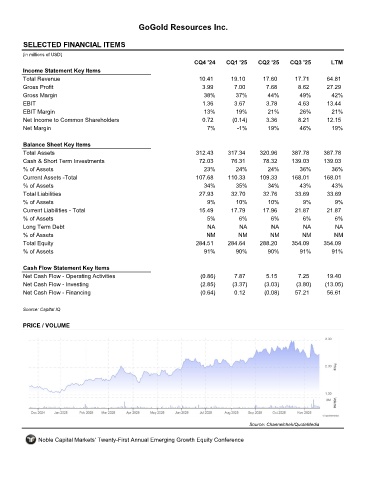
GoGold Resources Inc.


         SELECTED FINANCIAL ITEMS                                 TSX:GGD
         (in millions of USD)
                                                                     CQ4 '24    CQ1 '25    CQ2 '25    CQ3 '25       LTM
         Income Statement Key Items
         Total Revenue                                                10.41      19.10       17.60      17.71      64.81
         Gross Profit                                                  3.99        7.00       7.68       8.62      27.29
         Gross Margin                                                   38%        37%        44%        49%        42%
         EBIT                                                          1.36        3.67       3.78       4.63      13.44
         EBIT Margin                                                    13%        19%        21%        26%        21%
         Net Income to Common Shareholders                             0.72       (0.14)      3.36       8.21      12.15
         Net Margin                                                      7%         -1%       19%        46%        19%

         Balance Sheet Key Items
         Total Assets                                                312.43     317.34     320.96      387.78     387.78
         Cash & Short Term Investments                                72.03      76.31       78.32     139.03     139.03
         % of Assets                                                    23%        24%        24%        36%         36%
         Current Assets -Total                                       107.68     110.33      109.33     168.01     168.01
         % of Assets                                                    34%        35%        34%        43%         43%
         Total Liabilities                                            27.93       32.70      32.76      33.69      33.69
         % of Assets                                                     9%        10%        10%          9%         9%
         Current Liabilities - Total                                  15.49      17.79       17.96      21.87      21.87
         % of Assets                                                     5%         6%         6%         6%          6%
         Long Term Debt                                                  NA         NA         NA          NA         NA
         % of Assets                                                     NM         NM         NM         NM         NM
         Total Equity                                                284.51     284.64     288.20      354.09     354.09
         % of Assets                                                    91%        90%        90%        91%        91%

         Cash Flow Statement Key Items
         Net Cash Flow - Operating Activities                          (0.86)      7.87       5.15       7.25      19.40
         Net Cash Flow - Investing                                     (2.85)     (3.37)     (3.03)     (3.80)    (13.05)
         Net Cash Flow - Financing                                     (0.64)      0.12      (0.08)     57.21      56.61

         Source: Capital IQ


         PRICE / VOLUME


                                                                                        Source: Channelchek/QuoteMedia

              Noble Capital Markets' Twenty-First Annual Emerging Growth Equity Conference
   84   85   86   87   88   89   90   91   92   93   94