
Page 91 - NobleCon21
P. 91
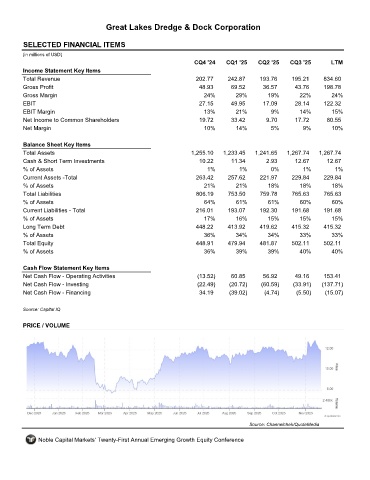
Great Lakes Dredge & Dock Corporation


         SELECTED FINANCIAL ITEMS                                 GLDD
         (in millions of USD)
                                                                     CQ4 '24    CQ1 '25    CQ2 '25    CQ3 '25       LTM
         Income Statement Key Items
         Total Revenue                                               202.77     242.87     193.76      195.21     834.60
         Gross Profit                                                 48.93      69.52       36.57      43.76     198.78
         Gross Margin                                                   24%        29%        19%        22%        24%
         EBIT                                                         27.15      49.95       17.09      28.14     122.32
         EBIT Margin                                                    13%        21%         9%        14%        15%
         Net Income to Common Shareholders                            19.72      33.42        9.70      17.72      80.55
         Net Margin                                                     10%        14%         5%          9%        10%

         Balance Sheet Key Items
         Total Assets                                               1,255.10   1,233.45   1,241.65   1,267.74   1,267.74
         Cash & Short Term Investments                                10.22      11.34        2.93      12.67      12.67
         % of Assets                                                     1%         1%         0%          1%         1%
         Current Assets -Total                                       263.42     257.62      221.97     229.84     229.84
         % of Assets                                                    21%        21%        18%        18%         18%
         Total Liabilities                                           806.19     753.50      759.78     765.63     765.63
         % of Assets                                                    64%        61%        61%        60%         60%
         Current Liabilities - Total                                 216.01     193.07     192.30      191.68     191.68
         % of Assets                                                    17%        16%        15%        15%        15%
         Long Term Debt                                              448.22     413.92     419.62      415.32     415.32
         % of Assets                                                    36%        34%        34%        33%        33%
         Total Equity                                                448.91     479.94     481.87      502.11     502.11
         % of Assets                                                    36%        39%        39%        40%        40%

         Cash Flow Statement Key Items
         Net Cash Flow - Operating Activities                         (13.52)    60.85       56.92      49.16     153.41
         Net Cash Flow - Investing                                    (22.49)    (20.72)    (60.59)    (33.91)   (137.71)
         Net Cash Flow - Financing                                    34.19      (39.02)     (4.74)     (5.50)    (15.07)

         Source: Capital IQ


         PRICE / VOLUME


                                                                                        Source: Channelchek/QuoteMedia

              Noble Capital Markets' Twenty-First Annual Emerging Growth Equity Conference