
Page 41 - AI & Machine Learning for Beginners: A Guided Workbook
P. 41
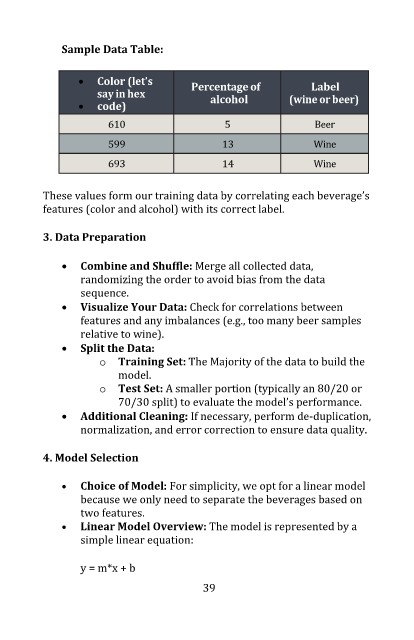
Sample Data Table:


                •  Color (let’s       Percentage of          Label
                    say in hex
                •  code)                 alcohol        (wine or beer)
                      610                   5                Beer
                      599                   13               Wine

                      693                   14               Wine

         These values form our training data by correlating each beverage’s
         features (color and alcohol) with its correct label.


         3. Data Preparation

             •  Combine and Shuffle: Merge all collected data,
                randomizing the order to avoid bias from the data
                sequence.
             •  Visualize Your Data: Check for correlations between
                features and any imbalances (e.g., too many beer samples
                relative to wine).
             •  Split the Data:
                    o  Training Set: The Majority of the data to build the
                        model.
                    o  Test Set: A smaller portion (typically an 80/20 or
                        70/30 split) to evaluate the model’s performance.
             •  Additional Cleaning: If necessary, perform de-duplication,
                normalization, and error correction to ensure data quality.


         4. Model Selection

             •  Choice of Model: For simplicity, we opt for a linear model
                because we only need to separate the beverages based on
                two features.
             •  Linear Model Overview: The model is represented by a
                simple linear equation:

                y = m*x + b
                                        39