
Page 57 - Reclaim YOUR DIGITAL GOLD (without audio)
P. 57
Data ColleCtion Harvesting
IS IT A GLASS OF WINE OR A GLASS OF
BEER?
The data will be obtained by observing the visual
appearance of beer and wine (in this case, mugs/
glasses). Data could be collected on a variety of drink
elements, including everything from the amount of foam
to the shape of the glass itself.
For the purposes of this explanation, we will concentrate
on just two of these factors: color (expressed as a
wavelength of light) and alcohol content (as a percentage).
It is expected that we will be able to divide our two drink
categories solely on these two characteristics. Color and
alcohol will be referred to as “features” from now on.
DATA COLLECTION
Data collection, the first serious phase of machine
learning, is now underway. This stage is critical
because the accuracy of the predictive model is directly
proportional to the quality and quantity of data obtained.
In other words, the accuracy of the predictive model
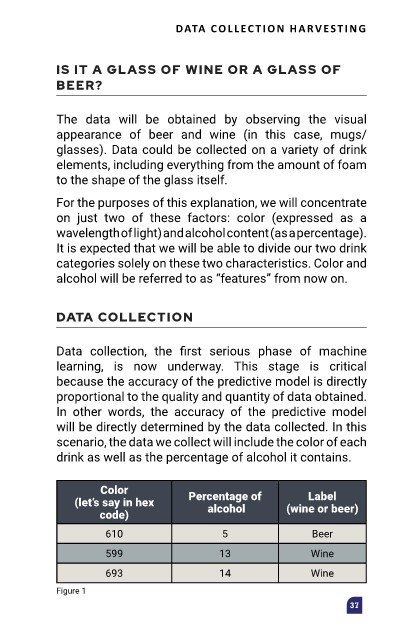
will be directly determined by the data collected. In this
scenario, the data we collect will include the color of each
drink as well as the percentage of alcohol it contains.
Color
(let’s say in hex Percentage of Label
code) alcohol (wine or beer)
610 5 Beer
599 13 Wine
693 14 Wine
Figure 1
37