Page 30 - PowerPoint Presentation
P. 30

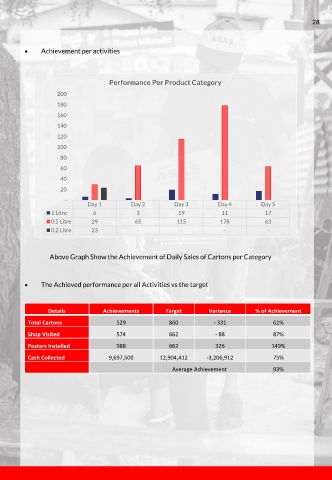
    Achievement per activities


                                     Performance Per Product Category
                    200
                    180

                    160
                    140
                    120
                    100
                     80

                     60
                     40
                     20
                       -
                              Day 1         Day 2         Day 3         Day 4         Day 5
                  1 Litre      6             3             19            11            17
                  0.5 Litre    29            65           115            178           63
                  0.2 Litre    23             -             -             -             -


                 Above Graph Show the Achievement of Daily Sales of Cartons per Category


             The Achieved performance per all Activities vs the target


                 Details           Achievements        Target        Variance       % of Achievement
          Total Cartons                529              860            - 331              61%
          Shop Visited                 574              662            - 88               87%

          Posters Installed            988              662            326               149%
          Cash Collected            9,697,500        12,904,412     -3,206,912            75%
                                                         Average Achievement              93%
   25   26   27   28   29   30   31   32   33   34   35