
Page 12 - Introduction-to-Set-Theory _Main.pdf10001_Neat
P. 12
Venn Diagrams
Venn diagrams are a useful way to visualize sets and their relationships. They consist of circles or other shapes representing different sets, where the
overlap between shapes shows the intersection of sets, and non-overlapping areas represent the difference between sets.
These diagrams are particularly helpful in illustrating set operations like union, intersection, and complement. They provide a clear, intuitive
representation of complex set relationships and are widely used in mathematics, logic, and statistics.
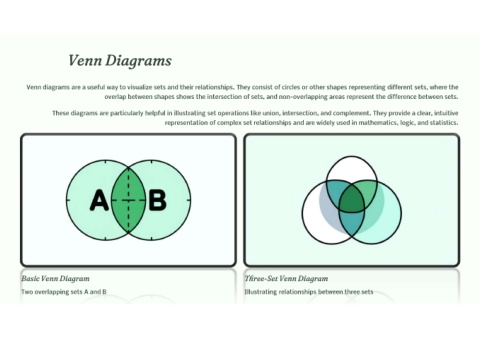
Basic Venn Diagram Three-Set Venn Diagram
Two overlapping sets A and B Illustrating relationships between three sets