
Page 45 - Basic Statistics
P. 45
40
3. NORMAL PROBABILITY DIRTRIBUTION
3.1 NORMAL CURVE
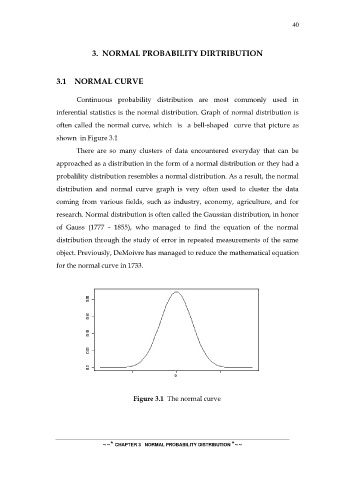
Continuous probability distribution are most commonly used in
inferential statistics is the normal distribution. Graph of normal distribution is
often called the normal curve, which is a bell-shaped curve that picture as
shown in Figure 3.1
There are so many clusters of data encountered everyday that can be
approached as a distribution in the form of a normal distribution or they had a
probalility distribution resembles a normal distribution. As a result, the normal
distribution and normal curve graph is very often used to cluster the data
coming from various fields, such as industry, economy, agriculture, and for
research. Normal distribution is often called the Gaussian distribution, in honor
of Gauss (1777 - 1855), who managed to find the equation of the normal
distribution through the study of error in repeated measurements of the same
object. Previously, DeMoivre has managed to reduce the mathematical equation
for the normal curve in 1733.
Figure 3.1 The normal curve
~~* CHAPTER 3 NORMAL PROBABILITY DISTRIBUTION *~~