
Page 48 - Final Approved 2017-2018 Student Accommodation Plan 2017-03-29
P. 48
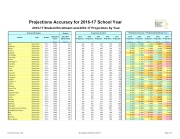
Projections Accuracy for 2016-17 School Year 2016-17 Student Enrollment and 2016-17 Projections by Year
School Information
Student
School
Type
Grades
Utilization Factor
(Note 1)
2016-2017 Membership
(Note 2)
Allen
Elementary
PK-6
100%
632
Andersen
Elementary
K-6
100%
701
Apollo
Elementary
K-6
100%
815
Atlantis
Elementary
PK-6
100%
648
Audubon
Elementary
PK-6
100%
599
Cambridge
Elementary
PK-6
100%
640
Cape View
Elementary
PK-6
100%
426
Carroll
Elementary
K-6
100%
660
Challenger 7
Elementary
PK-6
100%
525
Columbia
Elementary
PK-6
100%
544
Coquina
Elementary
K-6
100%
523
Creel
Elementary
PK-6
100%
940
Croton
Elementary
PK-6
100%
615
Discovery
Elementary
PK-6
100%
625
Endeavour
Elementary
PK-6
100%
890
Enterprise
Elementary
K-6
100%
543
Fairglen
Elementary
PK-6
100%
703
Freedom 7
Elementary
K-6
100%
409
Gemini
Elementary
K-6
100%
451
Golfview
Elementary
PK-6
100%
619
Harbor City
Elementary
PK-6
100%
401
Holland
Elementary
PK-6
100%
466
Imperial Estates
Elementary
K-6
100%
718
Indialantic
Elementary
K-6
100%
751
Jupiter
Elementary
PK-6
100%
793
Lockmar
Elementary
PK-6
100%
728
Longleaf
Elementary
PK-6
100%
683
Manatee
Elementary
K-6
100%
864
McAuliffe
Elementary
PK-6
100%
786
Meadowlane Intermediate
Elementary
3-6
100%
1,010
Meadowlane Primary
Elementary
K-6
100%
748
Mila
Elementary
PK-6
100%
534
Mims
Elementary
PK-6
100%
485
Oak Park
Elementary
PK-6
100%
922
Ocean Breeze
Elementary
PK-6
100%
519
Projections for 2016
700 712 718 763 597
826 771 856 749 727
687 642 699 645 561
421 404 379 412 347
634 618 574 646 492
550 571 662 785 661
960 979 993 1041 886
657 639 719 692 666
529 505 519 479 644
701 679 636 597 558
414 414 414 414 414
456 450 419 444 489
644 710 725 556 648
Projections Accuracy = Projected-Actual/Actual (Note 3)
2015 Projection
2014 Projection
2013 Projection
2012 Projection
2011 Projection
2015 Projection
Year 1
-1.27%
-0.14%
1.35%
7.34%
-1.17%
-3.94%
5.16%
2.13%
6.83%
-2.58%
-0.28%
1.22%
1.11%
4.04%
2014 Projection
Year 2
0.00%
1.57%
-5.40%
0.31%
-5.16%
-6.36%
9.18%
4.15%
3.90%
-7.00%
-3.41%
-0.22%
14.70%
2013 Projection
Year 3
-6.01%
2.43%
-11.03%
-13.03%
5.64%
16.91%
-9.53%
-7.10%
17.12%
2012 Projection
Year 4
-14.87%
8.84%
-2.12%
10.74%
12.52%
-1.55%
-10.18%
2011 Projection
Year 5
624 632 594 538 443
-29.91%
-14.84%
5.03%
-8.10%
-10.80%
586 596 575 638 613
662 652 850 665 504
-9.57%
10.52%
-8.02%
8.85%
-11.27%
41.90%
-1.54%
-5.40%
11.02%
-15.86%
9.22%
0.78%
-12.34%
-3.29%
-18.54%
-25.45%
507 474 535 465 422
556 554 510 625 765
-3.43%
2.21%
-9.71%
1.84%
1.90%
-6.25%
-11.43%
-19.62%
14.89%
40.63%
26.58%
50.10%
26.39%
-5.74%
8.29%
626 710 726 638 722
0.16%
13.60%
16.16%
2.08%
15.52%
852 869 768 994 807
-4.27%
-2.36%
-13.71%
11.69%
-9.33%
-4.42%
-11.79%
18.60%
-15.08%
-20.63%
1.22%
1.22%
1.22%
1.22%
8.43%
4.68%
432 393 450 436 417
443 431 447 407 402
7.73%
-4.94%
-2.00%
-7.51%
12.22%
-4.08%
8.73%
-12.66%
3.99%
-13.73%
650 659 675 628 819
746 754 752 784 768
831 889 730 919 742
-9.47%
4.79%
-8.22%
12.11%
-5.99%
-12.53%
14.07%
-0.67%
0.40%
0.13%
4.39%
2.26%
-7.94%
15.89%
-6.43%
727 777 790 810 797
626 557 575 583 631
845 855 817 915 1089
730 684 748 755 768
492 503 464 508 572
538 589 684 615 427
874 837 758 824 499
-0.14%
-8.35%
-2.20%
-2.41%
-7.87%
-5.21%
6.73%
-18.45%
-1.04%
-8.56%
-5.81%
-9.22%
8.52%
-15.81%
-5.44%
-17.79%
11.26%
5.90%
-10.63%
9.48%
-14.64%
-7.61%
26.04%
768 719 813 820 655
-2.29%
-8.52%
3.44%
4.33%
-16.67%
1040 1030 1084 1087 1090
2.97%
1.98%
7.33%
7.62%
7.92%
0.00%
0.94%
2.67%
-13.11%
-4.87%
7.12%
10.93%
21.44%
41.03%
26.80%
-11.96%
-45.88%
515 525 549 588 639
-0.77%
1.16%
5.78%
13.29%
23.12%
Facilities Services / DGL Board Approved March 28, 2017 Page 1 of 3
