
Page 49 - Final Approved 2017-2018 Student Accommodation Plan 2017-03-29
P. 49
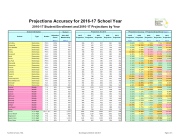
Projections Accuracy for 2016-17 School Year 2016-17 Student Enrollment and 2016-17 Projections by Year
School Information
Student
School
Type
Grades
Utilization Factor
(Note 1)
2016-2017 Membership
(Note 2)
Palm Bay
Elementary
PK-6
100%
799
Pinewood
Elementary
PK-6
100%
530
Port Malabar
Elementary
PK-6
100%
741
Quest
Elementary
PK-6
100%
900
Riviera
Elementary
PK-6
100%
647
Roosevelt
Elementary
K-6
100%
359
Sabal
Elementary
PK-6
100%
550
Saturn
Elementary
PK-6
100%
763
Sea Park
Elementary
PK-6
100%
339
Sherwood
Elementary
PK-6
100%
485
Stevenson
Elementary
K-6
100%
484
Sunrise
Elementary
PK-6
100%
841
Suntree
Elementary
K-6
100%
657
Surfside
Elementary
K-6
100%
475
Tropical
Elementary
K-6
100%
787
Turner
Elementary
PK-6
100%
631
University Park
Elementary
PK-6
100%
546
West Melbourne
Elementary
K-6
100%
550
Westside
Elementary
K-6
100%
712
Williams
Elementary
PK-6
100%
581
Central
Middle
7-8
90%
1,098
DeLaura
Middle
7-8
90%
703
Hoover
Middle
7-8
90%
509
Jackson
Middle
7-8
90%
584
Jefferson
Middle
7-8
90%
606
Johnson
Middle
7-8
90%
791
Kennedy
Middle
7-8
90%
632
Madison
Middle
7-8
90%
444
McNair
Middle
7-8
90%
456
Southwest
Middle
7-8
90%
880
Stone
Middle
7-8
90%
839
Cocoa
Jr / Sr High
PK, 7-12
90%
1,572
Cocoa Beach
Jr / Sr High
7-12
90%
1,064
Edgewood
Jr / Sr High
7-12
90%
948
Space Coast
Jr / Sr High
7-12
90%
1,519
West Shore
Jr / Sr High
7-12
90%
955
Projections for 2016
382 378 433 485 342
573 579 615 624 611
779 748 704 861 771
325 351 390 479 452
490 490 486 498 494
851 872 699 749 863
464 445 387 395 370
760 771 701 782 726
707 788 728 818 796
638 653 651 631 616
552 552 552 552 468
691 818 804 670 756
541 505 534 596 520
776 847 821 762 848
601 662 575 648 655
464 479 462 457 420
854 799 814 826 776
950 950 949 950 950
1531 1451 1294 1258 1436
Projections Accuracy = Projected-Actual/Actual (Note 3)
2015 Projection
2014 Projection
2013 Projection
2012 Projection
2011 Projection
2015 Projection
Year 1
6.41%
4.18%
2.10%
-4.13%
1.24%
-2.32%
-3.43%
16.85%
0.36%
-2.95%
-6.88%
-1.90%
-4.91%
4.50%
1.79%
0.21%
0.79%
2014 Projection
Year 2
5.29%
3.54%
1.24%
-6.32%
-2.03%
19.60%
0.36%
14.89%
-13.08%
4.75%
7.88%
-4.77%
0.21%
-4.48%
2013 Projection
Year 3
20.61%
15.04%
0.41%
-18.53%
19.23%
0.36%
4.05%
0.11%
-14.81%
2012 Projection
Year 4
41.30%
15.57%
0.36%
2.93%
0.21%
-17.18%
2011 Projection
Year 5
836 871 857 861 883
775 788 775 744 654
852 838 663 920 847
4.63%
-5.33%
9.01%
-14.15%
-6.89%
7.26%
7.76%
-17.55%
-26.33%
-21.89%
10.51%
503 455 437 414 292
-5.09%
4.59%
6.34%
4.59%
0.40%
-44.91%
-11.74%
2.22%
-5.89%
738 763 851 891 799
14.06%
17.93%
31.53%
37.71%
23.49%
35.10%
-4.74%
5.27%
11.82%
13.45%
11.09%
-1.97%
-7.73%
12.84%
1.05%
33.33%
505 554 558 494 463
4.12%
14.23%
15.05%
1.86%
-4.54%
2.89%
2.07%
1.19%
3.69%
-16.88%
-10.94%
2.62%
628 602 614 506 646
-4.41%
-8.37%
-6.54%
-22.98%
-1.67%
-16.84%
-22.11%
-10.93%
-0.64%
-7.75%
12.04%
24.88%
15.37%
29.64%
26.15%
12.82%
-14.91%
12.92%
-5.90%
6.18%
-8.09%
2.58%
-10.50%
1115 1159 1115 1215 1120
10.66%
679 727 617 638 691
496 546 525 484 463
575 605 582 604 531
610 577 559 530 535
1.55%
-3.41%
-2.55%
-1.54%
0.66%
5.56%
3.41%
7.27%
3.60%
-4.79%
1.55%
-12.23%
3.14%
-7.76%
-4.91%
2.00%
-9.25%
-1.71%
-9.04%
-0.34%
3.42%
-9.08%
-12.54%
-11.72%
7.08%
3.79%
-3.67%
7.21%
-9.02%
2.53%
3.64%
-5.41%
502 501 448 515 580
10.09%
9.87%
-1.75%
12.94%
27.19%
869 957 933 988 1112
-1.25%
8.75%
6.02%
-2.98%
12.27%
-1.55%
26.36%
-7.51%
1601 1784 1603 1317 958
13.49%
1.97%
-16.22%
1085 1120 1096 1192 1336
1.84%
1.97%
5.26%
3.01%
12.03%
-39.06%
25.56%
0.21%
-5.46%
956 962 956 956 955
0.10%
0.73%
0.10%
0.10%
0.00%
Facilities Services / DGL Board Approved March 28, 2017 Page 2 of 3
