
Page 50 - Final Approved 2017-2018 Student Accommodation Plan 2017-03-29
P. 50
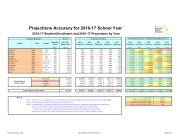
Projections Accuracy for 2016-17 School Year 2016-17 Student Enrollment and 2016-17 Projections by Year
School Information
Student
School
Type
Grades
Utilization Factor
(Note 1)
2016-2017 Membership
(Note 2)
Astronaut
High
9-12
95%
1,132
Bayside
High
9-12
95%
1,712
Eau Gallie
High
PK, 9-12
95%
1,672
Heritage
High
9-12
95%
1,855
Melbourne
High
9-12
95%
2,304
Merritt Island
High
PK, 9-12
95%
1,574
Palm Bay
High
PK, 9-12
95%
1,637
Rockledge
High
9-12
95%
1,460
Satellite
High
PK, 9-12
95%
1,356
Titusville
High
9-12
95%
1,394
Viera
High
PK, 9-12
95%
2,117
2015 Projection
School District Group Totals
Elementary
35,293
Middle
7,542
Jr/Sr High
6,058
High
18,213
35,439
17,916
2014 Projection
35,604
Projections for 2016
2013 Projection
35,646
16,740
2012 Projection
36,435
16,562
2011 Projection
1077 1066 1130 989 887
1646 1531 1554 1393 1606
1710 1755 1565 1599 1633
1846 1858 1854 1762 2041
2290 2278 2167 1904 2267
34,650
17,570
Projections Accuracy = Projected-Actual/Actual (Note 3)
2015 Projection
Year 1
-4.86%
-3.86%
-0.61%
0.41%
2014 Projection
Year 2
-10.57%
0.88%
2013 Projection
Year 3
1.00%
2012 Projection
Year 4
2011 Projection
Year 5
-5.83%
-0.18%
-12.63%
-21.64%
-9.23%
-18.63%
-6.19%
2.27%
-0.49%
4.96%
0.16%
-6.40%
-0.05%
-4.37%
-5.01%
-2.33%
1575 1624 1476 1385 1335
1558 1624 1401 1632 1735
1450 1524 1249 1496 1375
-0.68%
1351 1330 1260 1173 1187
-0.37%
-1.13%
4.38%
-1.92%
-5.95%
-14.45%
-7.08%
-17.36%
2.47%
-13.50%
10.03%
-1.61%
0.06%
-4.83%
3.18%
-0.79%
-6.23%
-14.42%
-12.01%
-0.31%
-15.18%
5.99%
-5.82%
1413 1383 1233 1262 1331
1.36%
2000 1979 1851 1967 2173
-5.53%
-1.63%
-0.79%
-6.52%
-11.55%
-12.56%
-9.47%
-7.09%
-12.46%
-4.52%
2.65%
-1.82%
-3.53%
School District Grand Totals
67,106
67,019
67,682
65,735
66,337
65,586
-0.13%
0.86%
-2.04%
-1.15%
-2.27%
-5% to 5%
Green
-10% to -5% and 5% to 10%
Yellow
-20% to -10% and 10% to 20%
Orange
-100% to -20% and 20% to 100%
Red
Notes:
Note 1: Note 2: Note 3:
Utilization Factors are established by the Florida Department of Education's (FDOE) State Requirements for Educational Facilities (SREF). Student Membership based on Final Fall Membership Count (10/17/16)
Percentage refers to the projected enrollment minus the actual enrollment numbers. Negative percentages indicate the projection was
below the actual enrollment and positive percentages indicate that the projection was above the actual enrollment. ***Projections accuracy is significantly affected by Attendance Boundary Changes and Grandfathering, Charter School expansion and contraction, BPS schools opening and closing, and the location decisions for Choice and Magnet Programs.
Facilities Services / DGL Board Approved March 28, 2017 Page 3 of 3
3.24%
7,541
7,859
7,451
7,667
7,731
-0.01%
4.20%
-1.21%
1.66%
2.51%
6,123
6,267
17,952
5,898
5,673
5,635
1.07%
3.45%
-1.43%
-2.64%
-8.09%
-6.36%
-9.06%
-6.98%
