
Page 53 - Final Approved 2017-2018 Student Accommodation Plan 2017-03-29
P. 53
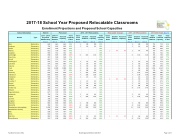
2017-18 School Year Proposed Relocatable Classrooms Enrollment Projections and Proposed School Capacities
School Information
Student
Permanent
2016 - 2017 Relocatables
Relocatable Changes
2017 - 2018 Relocatables
2017-2018 Totals (Note 10)
School
Type
2017 - 2018 Projected Membership (Note 2)
2016-17 Student Stations (Note 3)
Factored Capacity
(Note 4)
Perm Capacity In Use (Note 5)
Class- room Units (Note 6)
Student Stations
(Note 7)
Factored Capacity
(Note 8)
Total Capacity in Use (Note 9)
Class- room Units
Student Stations
Factored Capacity
Class- room Units (Note 6)
Student Stations
(Note 7)
Factored Capacity
(Note 8)
Total Student Stations
Total Factored Capacity
Total Capacity In Use
Allen
Elementary
638
663
663
96%
5
88
88
85%
5
88
88
751
751
85%
Andersen
Elementary
704
840
840
84%
2
44
44
80%
2
44
44
884
884
80%
Apollo
Elementary
805
902
902
89%
89%
902
902
89%
Atlantis
Elementary
661
703
703
94%
94%
2
44
44
2
44
44
747
747
89%
Audubon
Elementary
593
761
761
78%
78%
761
761
78%
Cambridge
Elementary
658
649
649
101%
6
116
116
86%
6
116
116
765
765
86%
Cape View
Elementary
421
548
548
77%
77%
548
548
77%
Carroll
Elementary
641
751
751
85%
85%
751
751
85%
Challenger 7
Elementary
532
551
551
97%
1
22
22
93%
1
22
22
573
573
93%
Columbia
Elementary
507
685
685
74%
3
66
66
68%
3
66
66
751
751
68%
Coquina
Elementary
531
627
627
85%
3
66
66
77%
3
66
66
693
693
77%
Creel
Elementary
936
1,088
1,088
86%
3
66
66
81%
3
66
66
1,154
1,154
81%
Croton
Elementary
619
707
707
88%
4
88
88
78%
4
88
88
795
795
78%
Discovery
Elementary
634
826
826
77%
7
154
154
65%
7
154
154
980
980
65%
Endeavour
Elementary
892
852
852
105%
7
138
138
90%
7
138
138
990
990
90%
Enterprise
Elementary
530
707
707
75%
1
22
22
73%
1
22
22
729
729
73%
Fairglen
Elementary
707
753
753
94%
94%
2
44
44
2
44
44
797
797
89%
Freedom 7
Elementary
414
453
453
91%
1
22
22
87%
1
22
22
475
475
87%
Gemini
Elementary
418
667
667
63%
2
44
44
59%
2
44
44
711
711
59%
Golfview
Elementary
635
689
689
92%
4
88
88
82%
4
88
88
777
777
82%
Harbor City
Elementary
387
453
453
85%
8
176
176
62%
8
176
176
629
629
62%
Holland
Elementary
450
605
605
74%
74%
605
605
74%
Imperial Estates
Elementary
677
729
729
93%
93%
729
729
93%
Indialantic
Elementary
730
754
754
97%
2
44
44
92%
2
44
44
798
798
92%
Jupiter
Elementary
781
780
780
100%
7
150
150
84%
7
150
150
930
930
84%
Lockmar
Elementary
728
892
892
82%
82%
892
892
82%
Longleaf
Elementary
700
790
790
89%
89%
790
790
89%
Manatee
Elementary
864
866
866
100%
5
88
88
91%
5
88
88
954
954
91%
McAuliffe
Elementary
784
754
754
104%
8
164
164
85%
8
164
164
918
918
85%
Meadowlane Intermediate
Elementary
1,000
894
894
112%
11
220
220
90%
11
220
220
1,114
1,114
90%
Meadowlane Primary
Elementary
742
824
824
90%
90%
824
824
90%
Mila
Elementary
538
707
707
76%
76%
707
707
76%
Mims
Elementary
501
725
725
69%
69%
725
725
69%
Oak Park
Elementary
944
906
906
104%
2
44
44
99%
1
22
22
3
66
66
972
972
97%
Ocean Breeze
Elementary
525
498
498
105%
8
156
156
80%
8
156
156
654
654
80%
Facilities Services / DGL Board Approved March 28, 2017 Page 1 of 3
