
Page 54 - Final Approved 2017-2018 Student Accommodation Plan 2017-03-29
P. 54
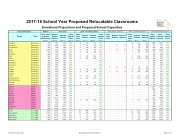
2017-18 School Year Proposed Relocatable Classrooms Enrollment Projections and Proposed School Capacities
School Information
Student
Permanent
2016 - 2017 Relocatables
Relocatable Changes
2017 - 2018 Relocatables
2017-2018 Totals (Note 10)
School
Type
2017 - 2018 Projected Membership (Note 2)
2016-17 Student Stations (Note 3)
Factored Capacity
(Note 4)
Perm Capacity In Use (Note 5)
Class- room Units (Note 6)
Student Stations
(Note 7)
Factored Capacity
(Note 8)
Total Capacity in Use (Note 9)
Class- room Units
Student Stations
Factored Capacity
Class- room Units (Note 6)
Student Stations
(Note 7)
Factored Capacity
(Note 8)
Total Student Stations
Total Factored Capacity
Total Capacity In Use
Palm Bay
Elementary
796
829
829
96%
8
176
176
79%
8
176
176
1,005
1,005
79%
Pinewood
Elementary
544
485
485
112%
3
66
66
99%
1
22
22
4
88
88
573
573
95%
Port Malabar
Elementary
744
768
768
97%
4
84
84
87%
4
84
84
852
852
87%
Quest
Elementary
1,000
910
910
110%
3
40
40
105%
4
88
88
7
128
128
1,038
1,038
96%
Riviera
Elementary
655
689
689
95%
4
88
88
84%
4
88
88
777
777
84%
Roosevelt
Elementary
360
599
599
60%
60%
599
599
60%
Sabal
Elementary
546
679
679
80%
5
106
106
70%
5
106
106
785
785
70%
Saturn
Elementary
750
848
848
88%
6
128
128
77%
6
128
128
976
976
77%
Sea Park
Elementary
322
461
461
70%
70%
461
461
70%
Sherwood
Elementary
480
609
609
79%
79%
609
609
79%
Stevenson
Elementary
508
569
569
89%
89%
569
569
89%
Sunrise
Elementary
858
895
895
96%
96%
1
22
22
1
22
22
917
917
94%
Suntree
Elementary
654
689
689
95%
3
66
66
87%
3
66
66
755
755
87%
Surfside
Elementary
468
439
439
107%
4
84
84
90%
2
44
44
6
128
128
567
567
83%
Tropical
Elementary
798
910
910
88%
88%
910
910
88%
Turner
Elementary
636
830
830
77%
2
44
44
73%
2
44
44
874
874
73%
University Park
Elementary
544
679
679
80%
6
132
132
67%
6
132
132
811
811
67%
West Melbourne
Elementary
552
618
618
89%
89%
618
618
89%
Westside
Elementary
719
835
835
86%
1
22
22
84%
1
22
22
857
857
84%
Williams
Elementary
581
627
627
93%
4
88
88
81%
4
88
88
715
715
81%
Central
Middle
1,129
1,694
1,525
74%
74%
1,694
1,525
74%
DeLaura
Middle
728
1,046
941
77%
77%
1,046
941
77%
Hoover
Middle
515
732
659
78%
78%
732
659
78%
Jackson
Middle
566
727
654
87%
87%
727
654
87%
Jefferson
Middle
610
949
854
71%
71%
949
854
71%
Johnson
Middle
791
1,111
1,000
79%
79%
1,111
1,000
79%
Kennedy
Middle
633
749
674
94%
7
154
139
78%
7
154
139
903
813
78%
Madison
Middle
450
825
743
61%
61%
825
743
61%
McNair
Middle
455
679
611
75%
75%
679
611
75%
Southwest
Middle
892
1,308
1,177
76%
76%
1,308
1,177
76%
Stone
Middle
800
1,126
1,013
79%
79%
1,126
1,013
79%
Cocoa
Jr / Sr High
1,599
1,730
1,557
103%
10
250
225
90%
10
250
225
1,980
1,782
90%
Cocoa Beach
Jr / Sr High
1,017
1,253
1,128
90%
15
375
338
69%
15
375
338
1,628
1,466
69%
Edgewood
Jr / Sr High
950
1,100
990
96%
6
91
82
89%
6
91
82
1,191
1,072
89%
Space Coast
Jr / Sr High
1,520
1,975
1,778
86%
2
38
34
84%
2
38
34
2,013
1,812
84%
West Shore
Jr / Sr High
956
1,232
1,109
86%
7
172
155
76%
7
172
155
1,404
1,264
76%
Facilities Services / DGL Board Approved March 28, 2017 Page 2 of 3
