
Page 55 - Final Approved 2017-2018 Student Accommodation Plan 2017-03-29
P. 55
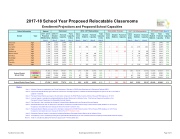
2017-18 School Year Proposed Relocatable Classrooms Enrollment Projections and Proposed School Capacities
School Information
Student
Permanent
2016 - 2017 Relocatables
Relocatable Changes
2017 - 2018 Relocatables
2017-2018 Totals (Note 10)
School
Type
2017 - 2018 Projected Membership (Note 2)
2016-17 Student Stations (Note 3)
Factored Capacity
(Note 4)
Perm Capacity In Use (Note 5)
Class- room Units (Note 6)
Student Stations
(Note 7)
Factored Capacity
(Note 8)
Total Capacity in Use (Note 9)
Class- room Units
Student Stations
Factored Capacity
Class- room Units (Note 6)
Student Stations
(Note 7)
Factored Capacity
(Note 8)
Total Student Stations
Total Factored Capacity
Total Capacity In Use
Astronaut
High
1,124
1,522
1,446
78%
78%
1,522
1,446
78%
Bayside
High
1,684
2,353
2,235
75%
75%
2,353
2,235
75%
Eau Gallie
High
1,639
2,050
1,948
84%
10
250
238
75%
1
25
24
11
275
261
2,325
2,209
74%
Heritage
High
1,784
2,436
2,314
77%
77%
2,436
2,314
77%
Melbourne
High
2,300
2,439
2,317
99%
99%
2
50
48
2
50
48
2,489
2,365
97%
Merritt Island
High
1,575
1,965
1,867
84%
2
50
48
82%
2
50
48
2,015
1,915
82%
Palm Bay
High
1,635
2,576
2,447
67%
7
175
166
63%
7
175
166
2,751
2,613
63%
Rockledge
High
1,470
1,703
1,618
91%
3
75
71
87%
3
75
71
1,778
1,689
87%
Satellite
High
1,325
1,570
1,492
89%
1
25
24
87%
1
25
24
1,595
1,516
87%
Titusville
High
1,395
1,970
1,872
75%
75%
1,970
1,872
75%
Viera
High
2,150
2,246
2,134
101%
5
125
119
95%
1
25
24
6
150
143
2,396
2,277
94%
School District Group Totals
Elementary
35,342
39,567
39,567
89%
153
3,190
3,190
83%
13
286
286
166
3,476
3,476
43,043
43,043
82%
Middle
7,569
10,946
9,851
77%
7
154
139
76%
-
-
-
7
154
139
11,100
9,990
76%
Jr/Sr High
6,042
7,290
6,562
92%
40
926
834
82%
-
-
-
40
926
834
8,216
7,396
82%
High
18,081
22,830
21,690
83%
28
700
666
81%
4
100
96
32
800
761
23,630
22,451
81%
School District Grand Totals
67,034
80,633
77,670
86%
228
4,970
4,829
81%
17
386
382
245
5,356
5,210
85,989
82,880
81%
Notes:
Note 1: Note 2:
Note 3: Note 4:
Note 5: Note 6:
Note 7:
Note 8:
Note 9: Note 10:
Utilization Factors are established by the Florida Department of Education's (FDOE) State Requirements for Educational Facilities (SREF).
Projected Student Membership figures based on Finance 2016-17 Budget Projections combined with Growth Management Projections for 2017-18 to 2020-21 (updated 11/23/2015).
Permanent Student Stations are based on the information contained in the FDOE Florida Inventory of School Houses (FISH) database on 12/13/16
Factored Capacity is calculated by multiplying Satisfactory Student Stations by the Utilization Factor. Total Factored Capacity is the addition of the
Permanent Factored Capacity plus the Relocatable Factored Capacity.
Perm Capacity in Use is calculated by dividing the Projected Student Membership by the Permanent Factored Capacity.
Relocatable Classroom Units are based on the information contained in the FDOE Florida Inventory of School Houses (FISH) database on 12/13/16 plus
the projected relocatable classroom changes for School Year 2016-17 (shown in red).
Relocatable Student Stations are based on the information contained in the FDOE Florida Inventory of School Houses (FISH) database on 12/01/15 plus
the projected relocatable classroom changes for School Year 2017-18 (shown in red).
Relocatable Factored Capacity is calculated by multiplying Satisfactory Relocatable Student Stations by the Utilization Factor.
Total Capacity in Use is calculated by dividing the Projected Student Membership by the sum of Permanent Factored Capacity and Relocatable Factored Capacity. Totals are calculated by adding Permanent and proposed 2017-18 Relocatable data.
Facilities Services / DGL Board Approved March 28, 2017 Page 3 of 3
