
Page 23 - Volume 41-Number 04 11-07-18.pdf
P. 23
mattered most in our patrons’ experiences. Having an effective and fun survey design led us to gather 8,000
responses a year which helped make us more confident in the data we captured. The analysis on the survey
dashboard was all done in real-time and automatically which expedited our analysis. Because the data and
visualizations are fully interactive, we could easily change the questions and comparisons we were doing.
What We’ve Learned/Addressed So Far
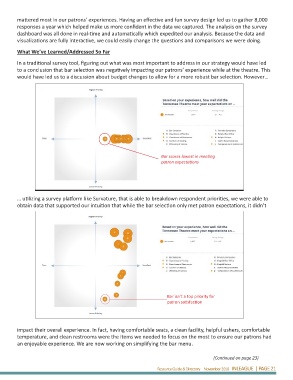
In a traditional survey tool, figuring out what was most important to address in our strategy would have led
to a conclusion that bar selection was negatively impacting our patrons’ experience while at the theatre. This
would have led us to a discussion about budget changes to allow for a more robust bar selection. However…
Bar scores lowest in meeting
patron expectations
… utilizing a survey platform like Survature, that is able to breakdown respondent priorities, we were able to
obtain data that supported our intuition that while the bar selection only met patron expectations, it didn’t
Bar isn’t a top priority for
patron satisfaction
impact their overall experience. In fact, having comfortable seats, a clean facility, helpful ushers, comfortable
temperature, and clean restrooms were the items we needed to focus on the most to ensure our patrons had
an enjoyable experience. We are now working on simplifying the bar menu.
(Continued on page 23)
Resource Guide & Directory November 2018 INLEAGUE | PAGE 21