
Page 306 - Accounting Principles (A Business Perspective)
P. 306
This book is licensed under a Creative Commons Attribution 3.0 License
Cost Retail
Merchandise inventory, 2010 January 1 $ 22,000 $ 40,000
Purchases 182,000 303,000
Purchase returns (2,000) (3,000)
Purchase allowances (3,000)
Transportation-in 5,000
Goods available for sale $204,000 $340,000
Cost/retail price ratio:
$204,000/$340,000=60%
Sales 280,000
Ending inventory at retail prices $ 60,000
Times cost/retail price ratio x 60%
Ending inventory at cost, 2010 March 31 $ 36,000
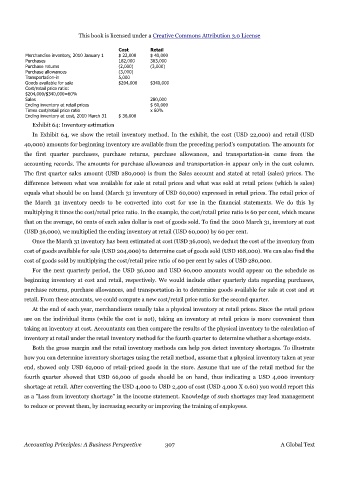
Exhibit 64: Inventory estimation
In Exhibit 64, we show the retail inventory method. In the exhibit, the cost (USD 22,000) and retail (USD
40,000) amounts for beginning inventory are available from the preceding period's computation. The amounts for
the first quarter purchases, purchase returns, purchase allowances, and transportation-in came from the
accounting records. The amounts for purchase allowances and transportation-in appear only in the cost column.
The first quarter sales amount (USD 280,000) is from the Sales account and stated at retail (sales) prices. The
difference between what was available for sale at retail prices and what was sold at retail prices (which is sales)
equals what should be on hand (March 31 inventory of USD 60,000) expressed in retail prices. The retail price of
the March 31 inventory needs to be converted into cost for use in the financial statements. We do this by
multiplying it times the cost/retail price ratio. In the example, the cost/retail price ratio is 60 per cent, which means
that on the average, 60 cents of each sales dollar is cost of goods sold. To find the 2010 March 31, inventory at cost
(USD 36,000), we multiplied the ending inventory at retail (USD 60,000) by 60 per cent.
Once the March 31 inventory has been estimated at cost (USD 36,000), we deduct the cost of the inventory from
cost of goods available for sale (USD 204,000) to determine cost of goods sold (USD 168,000). We can also find the
cost of goods sold by multiplying the cost/retail price ratio of 60 per cent by sales of USD 280,000.
For the next quarterly period, the USD 36,000 and USD 60,000 amounts would appear on the schedule as
beginning inventory at cost and retail, respectively. We would include other quarterly data regarding purchases,
purchase returns, purchase allowances, and transportation-in to determine goods available for sale at cost and at
retail. From these amounts, we could compute a new cost/retail price ratio for the second quarter.
At the end of each year, merchandisers usually take a physical inventory at retail prices. Since the retail prices
are on the individual items (while the cost is not), taking an inventory at retail prices is more convenient than
taking an inventory at cost. Accountants can then compare the results of the physical inventory to the calculation of
inventory at retail under the retail inventory method for the fourth quarter to determine whether a shortage exists.
Both the gross margin and the retail inventory methods can help you detect inventory shortages. To illustrate
how you can determine inventory shortages using the retail method, assume that a physical inventory taken at year
end, showed only USD 62,000 of retail-priced goods in the store. Assume that use of the retail method for the
fourth quarter showed that USD 66,000 of goods should be on hand, thus indicating a USD 4,000 inventory
shortage at retail. After converting the USD 4,000 to USD 2,400 of cost (USD 4,000 X 0.60) you would report this
as a "Loss from inventory shortage" in the income statement. Knowledge of such shortages may lead management
to reduce or prevent them, by increasing security or improving the training of employees.
Accounting Principles: A Business Perspective 307 A Global Text