
Page 679 - Accounting Principles (A Business Perspective)
P. 679
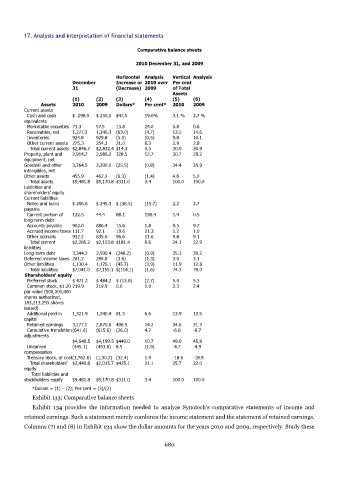
17. Analysis and interpretation of financial statements

                                                 Comparative balance sheets

                                                 2010 December 31, and 2009

                                          Horizontal  Analysis  Vertical  Analysis
                          December        Increase or  2010 over  Per cent
                          31              (Decrease) 2009     of Total
                                                              Assets
                          (1)      (2)    (3)       (4)       (5)    (6)
               Assets     2010     2009   Dollars*  Per cent*  2010  2009
          Current assets
            Cash and cash   $  298.0  $ 250,5  $47.5  19.0%   3.1 %  2.7 %
          equivalents
            Marketable securities 71.3  57.5  13.8  24.0      0.8    0.6
            Receivables, net  1,277.3  1,340.3  (63.0)  (4.7)  13.5  14.6
            Inventories   924.8    929.8  (5.0)     (0.5)     9.8    10.1
            Other current assets 275.3  254.3  21.0  8.3      2.9    2.8
              Total current assets $2,846.7  $2,832.4 $14.3  0.5  30.0  30.9
          Property, plant and   2,914.7  2,586.2  328.5  12.7  30.7  28.2
          equipment, net
          Goodwill and other   3,264.5  3,290.0  (25.5)  (0.8)  34.4  35.9
          intangibles, net
          Other assets    455.9    462.2  (6.3)     (1.4)     4.8    5.0
              Total assets  $9,481.8  $9,170.8 $311.0  3.4    100.0  100.0
          Liabilities and
          shareholders' equity
          Current liabilities
            Notes and loans   $ 206.8  $ 245.3  $ (38.5)  (15.7)  2.2  2.7
          payable
            Current portion of   132.5  44.4  88.1  198.4     1.4    0.5
          long-term debt
            Accounts payable  902.0  886.4  15.6    1.8       9.5    9.7
            Accrued income taxes 111.7  92.1  19.6  21.3      1.2    1.0
            Other accruals  932.2  835.6  96.6      11.6      9.8    9.1
              Total current   $2,285.2  $2,103.8 $181.4  8.6  24.1   22.9
          liabilities
          Long-term debt  3,344.2  3,590.4  (246.2)  (6.9)    35.3   39.2
          Deferred income taxes 281.2  284.8  (3.6)  (1.3)    3.0    3.1
          Other liabilities  1,130.4  1,176.1  (45.7)  (3.9)  11.9   12.8
              Total liabilities  $7,041.0  $7,155.1 $(114.1)  (1.6)  74.3  78.0
          Shareholders' equity
            Preferred stock  $ 471.2  $ 484.2  $ (13.0)  (2.7)  5.0  5.3
            Common stock, $1.20 219.9  219.9  0.0   0.0       2.3    2.4
          par value (500,000,000
          shares authorized,
          183,213,295 shares
          issued)
            Additional paid-in   1,321.9  1,240.4  81.5  6.6  13.9   13.5
          capital
            Retained earnings  3,277.1  2,870.6  406.5  14.2  34.6   31.3
            Cumulative translation (641.6)  (615.6)  (26.0)  4.2  -6.8  -6.7
          adjustments
                          $4,648.5  $4,199.5 $449.0  10.7     49.0   45.8
            Unearned      (445.1)  (453.6)  8.5     (1.9)     -4.7   -4.9
          compensation
            Treasury stock, at cost(1,762.6)  (1,30.2) (32.4)  1.9  -18.6  -18.9
              Total shareholders'  $2,440.8  $2,015.7 $425.1  21.1  25.7  22.0
          equity
               Total liabilities and
          stockholders equity  $9,481.8  $9,170.8 $311.0  3.4  100.0  100.0
            *Dollars = (1) – (2); Per cent = (3)/(2)
            Exhibit 133: Comparative balance sheets
            Exhibit 134  provides the information needed to analyze Synotech's comparative statements of income and

          retained earnings. Such a statement merely combines the income statement and the statement of retained earnings.
          Columns (7) and (8) in Exhibit 134 show the dollar amounts for the years 2010 and 2009, respectively. Study these


                                                           680