
Page 680 - Accounting Principles (A Business Perspective)
P. 680
This book is licensed under a Creative Commons Attribution 3.0 License
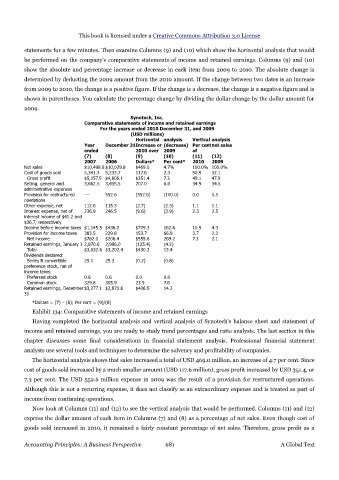
statements for a few minutes. Then examine Columns (9) and (10) which show the horizontal analysis that would
be performed on the company's comparative statements of income and retained earnings. Columns (9) and (10)
show the absolute and percentage increase or decrease in each item from 2009 to 2010. The absolute change is
determined by deducting the 2009 amount from the 2010 amount. If the change between two dates is an increase
from 2009 to 2010, the change is a positive figure. If the change is a decrease, the change is a negative figure and is
shown in parentheses. You calculate the percentage change by dividing the dollar change by the dollar amount for
2009.
Synotech, Inc.
Comparative statements of income and retained earnings
For the years ended 2010 December 31, and 2009
(USD millions)
Horizontal analysis Vertical analysis
Year December 31Increase or (decrease) Per cent net sales
ended 2010 over 2009 of
(7) (8) (9) (10) (11) (12)
2007 2006 Dollars* Per cent* 2010 2009
Net sales $10,498.8 $10,029.8 $469.0 4.7% 100.0% 100.0%
Cost of goods sold 5,341.3 5,233.7 117.6 2.3 50.9 52.1
Gross profit $5,157.5 $4,806.1 $351.4 7.3 49.1 47.9
Selling, general and 3,662.5 3,455.5 207.0 6.0 34.9 34.5
administrative expenses
Provision for restructured --- 552.6 (552.6) (100.0) 0.0 5.5
operations
Other expense, net 112.6 115.3 (2.7) (2.3) 1.1 1.1
Interest expense, net of 236.9 246.5 (9.6) (3.9) 2.3 2.5
interest income of $41.2 and
$36.7, respectively
Income before income taxes $1,145.5 $436.2 $709.3 162.6 10.9 4.3
Provision for income taxes 383.5 229.8 153.7 66.9 3.7 2.3
Net income $762.0 $206.4 $555.6 269.2 7.3 2.1
Retained earnings, January 1 2,870.6 2,996.0 (125.4) (4.2)
Total $3,632.6 $3,202.4 $430.2 13.4
Dividends declared:
Series B convertible 25.1 25.3 (0.2) (0.8)
preference stock, net of
income taxes
Preferred stock 0.6 0.6 0.0 0.0
Common stock 329.8 305.9 23.9 7.8
Retained earnings, December $3,277.1 $2,870.6 $406.5 14.2
31
*Dollars = (7) – (8); Per cent = (9)/(8)
Exhibit 134: Comparative statements of income and retained earnings
Having completed the horizontal analysis and vertical analysis of Synotech's balance sheet and statement of
income and retained earnings, you are ready to study trend percentages and ratio analysis. The last section in this
chapter discusses some final considerations in financial statement analysis. Professional financial statement
analysts use several tools and techniques to determine the solvency and profitability of companies.
The horizontal analysis shows that sales increased a total of USD 469.0 million, an increase of 4.7 per cent. Since
cost of goods sold increased by a much smaller amount (USD 117.6 million), gross profit increased by USD 351.4, or
7.3 per cent. The USD 552.6 million expense in 2009 was the result of a provision for restructured operations.
Although this is not a recurring expense, it does not classify as an extraordinary expense and is treated as part of
income from continuing operations.
Now look at Columns (11) and (12) to see the vertical analysis that would be performed. Columns (11) and (12)
express the dollar amount of each item in Columns (7) and (8) as a percentage of net sales. Even though cost of
goods sold increased in 2010, it remained a fairly constant percentage of net sales. Therefore, gross profit as a
Accounting Principles: A Business Perspective 681 A Global Text