
Page 719 - Accounting Principles (A Business Perspective)
P. 719
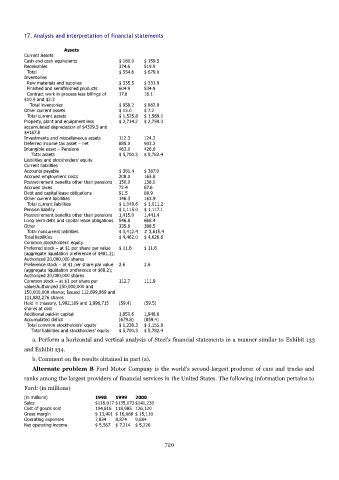
17. Analysis and interpretation of financial statements

                        Assets
          Current Assets
          Cash and cash equivalents        $ 180.0  $ 159.5
          Receivables                      374.6    519.5
            Total                          $ 554.6  $ 679.0
          Inventories
            Raw materials and supplies     $ 335.5  $ 331.9
            Finished and semifinished products  604.9  534.9
            Contract work in process less billings of   17.8  16.1
          $10.9 and $2.3
              Total inventories            $ 958.2  $ 882.9
          Other current assets             $ 13.0   $ 7.2
            Total current assets           $ 1,525.8  $ 1,569.1
          Property, plant and equipment less   $ 2,714.2  $ 2,759.3
          accumulated depreciation of $4329.5 and
          $4167.8
          Investments and miscellaneous assets  112.3  124.2
          Deferred income tax asset – net  885.0    903.2
          Intangible asset – Pensions      463.0    426.6
               Total assets                $ 5,700.3  $ 5,782.4
          Liabilities and stockholders' equity
          Current liabilities
          Accounts payable                 $ 381.4  $ 387.0
          Accrued employment costs         208.0    165.8
          Postretirement benefits other than pensions  150.0  138.0
          Accrued taxes                    72.4     67.6
          Debt and capital lease obligations  91.5  88.9
          Other current liabilities        146.3    163.9
            Total current liabilities      $ 1,049.6  $ 1,011.2
          Pension liability                $ 1,115.0  $ 1,117.1
          Postretirement benefits other than pensions  1,415.0  1,441.4
          Long-term debt and capital lease obligations  546.8  668.4
          Other                            335.6    388.5
            Total noncurrent liabilities   $ 3,412.4  # 3,615.4
          Total liabilities                $ 4,462.0  $ 4,626.6
          Common stockholders' equity
          Preferred stock – at $1 per share par value   $ 11.6  $ 11.6
          (aggregate liquidation preference of $481.2);
          Authorized 20,000,000 shares
          Preference stock – at $1 per share par value  2.6  2.6
          (aggregate liquidation preference of $88.2);
          Authorized 20,000,000 shares
          Common stock – at $1 per share par   112.7  111.9
          value/Authorized 250,000,000 and
          150,000,000 shares; Issued 112,699,869 and
          111,882,276 shares
          Held in treasury, 1,992,189 and 1,996,715   (59.4)  (59.5)
          shares at cost
          Additional paid-in capital       1,850.6  1,948.6
          Accumulated deficit              (679.8)  (859.4)
            Total common stockholders' equity  $ 1,238.3  $ 1,155.8
               Total liabilities and stockholders' equity  $ 5,700.3  $ 5,782.4
            a. Perform a horizontal and vertical analysis of Steel's financial statements in a manner similar to Exhibit 133
          and Exhibit 134.
            b. Comment on the results obtained in part (a).
            Alternate problem B  Ford Motor Company is the world's second-largest producer of cars and trucks and
          ranks among the largest providers of financial services in the United States. The following information pertains to
          Ford: (in millions)
          (in millions)           1998    1999   2000
          Sales                   $118.017 $135,073 $141,230
          Cost of goods sold      104,616 118,985 126,120
          Gross margin            $ 13,401 $ 16,088 $ 15,110
          Operating expenses      7,834   8,874  9,884
          Net operating income    $ 5,567  $ 7,214  $ 5,226


                                                           720