
Page 813 - Accounting Principles (A Business Perspective)
P. 813
20. Using accounting for quality and cost management
Accountants estimated the overhead and the volume of events for each activity. For example, management
estimated the company would purchase 100,000 pieces of materials that would require overhead costs of USD
200,000 for the year. These overhead costs included salaries of people to purchase, inspect, and store materials.
Consequently, each piece of material used to make a product would be assigned an overhead cost of USD 2.00 (USD
200,000/100,000 pieces).
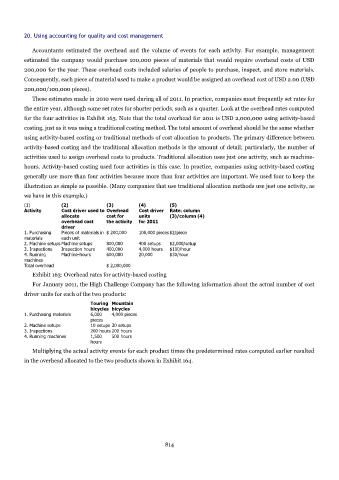
These estimates made in 2010 were used during all of 2011. In practice, companies most frequently set rates for
the entire year, although some set rates for shorter periods, such as a quarter. Look at the overhead rates computed
for the four activities in Exhibit 163. Note that the total overhead for 2011 is USD 2,000,000 using activity-based
costing, just as it was using a traditional costing method. The total amount of overhead should be the same whether
using activity-based costing or traditional methods of cost allocation to products. The primary difference between
activity-based costing and the traditional allocation methods is the amount of detail; particularly, the number of
activities used to assign overhead costs to products. Traditional allocation uses just one activity, such as machine-
hours. Activity-based costing used four activities in this case. In practice, companies using activity-based costing
generally use more than four activities because more than four activities are important. We used four to keep the
illustration as simple as possible. (Many companies that use traditional allocation methods use just one activity, as
we have in this example.)
(1) (2) (3) (4) (5)
Activity Cost driver used to Overhead Cost driver Rate: column
allocate cost for units (3)/column (4)
overhead cost the activity for 2011
driver
1. Purchasing Pieces of materials in $ 200,000 100,000 pieces $2/piece
materials each unit
2. Machine setups Machine setups 800,000 400 setups $2,000/setup
3. Inspections Inspection hours 400,000 4,000 hours $100/hour
4. Running Machine-hours 600,000 20,000 $30/hour
machines
Total overhead $ 2,000,000
Exhibit 163: Overhead rates for activity-based costing
For January 2011, the High Challenge Company has the following information about the actual number of cost
driver units for each of the two products:
Touring Mountain
bicycles bicycles
1. Purchasing materials 6,000 4,000 pieces
pieces
2. Machine setups 10 setups 30 setups
3. Inspections 200 hours 200 hours
4. Running machines 1,500 500 hours
hours
Multiplying the actual activity events for each product times the predetermined rates computed earlier resulted
in the overhead allocated to the two products shown in Exhibit 164.
814