
Page 818 - Accounting Principles (A Business Perspective)
P. 818
This book is licensed under a Creative Commons Attribution 3.0 License
hours)
Total $300,000
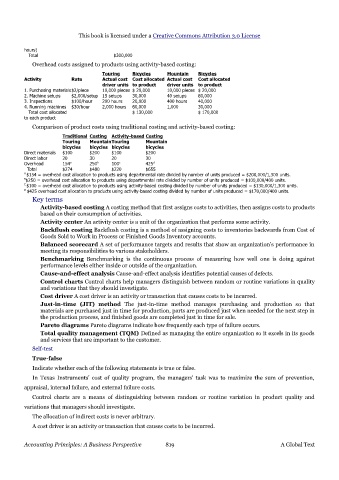
Overhead costs assigned to products using activity-based costing:
Touring Bicycles Mountain Bicycles
Activity Rate Actual cost Cost allocated Actual cost Cost allocated
driver units to product driver units to product
1. Purchasing materials$2/piece 10,000 pieces $ 20,000 10,000 pieces $ 20,000
2. Machine setups $2,000/setup 15 setups 30,000 40 setups 80,000
3. Inspections $100/hour 200 hours 20,000 400 hours 40,000
4. Running machines $30/hour 2,000 hours 60,000 1,000 30,000
Total cost allocated $ 130,000 $ 170,000
to each product
Comparison of product costs using traditional costing and activity-based costing:
Traditional Costing Activity-based Costing
Touring MountainTouring Mountain
bicycles bicycles bicycles bicycles
Direct materials $100 $200 $100 $200
Direct labor 20 30 20 30
Overhead 154 a 250 b 100 c 425 d
Total $274 $480 $220 $655
A $154 = overhead cost allocation to products using departmental rate divided by number of units produced = $200,000/1,300 units.
B $250 = overhead cost allocation to products using departmental rate divided by number of units produced = $100,000/400 units.
C $100 = overhead cost allocation to products using activity-based costing divided by number of units produced = $130,000/1,300 units.
D $425 overhead cost allocation to products using activity-based costing divided by number of units produced = $170,000/400 units.
Key terms
Activity-based costing A costing method that first assigns costs to activities, then assigns costs to products
based on their consumption of activities.
Activity center An activity center is a unit of the organization that performs some activity.
Backflush costing Backflush costing is a method of assigning costs to inventories backwards from Cost of
Goods Sold to Work in Process or Finished Goods Inventory accounts.
Balanced scorecard A set of performance targets and results that show an organization's performance in
meeting its responsibilities to various stakeholders.
Benchmarking Benchmarking is the continuous process of measuring how well one is doing against
performance levels either inside or outside of the organization.
Cause-and-effect analysis Cause-and-effect analysis identifies potential causes of defects.
Control charts Control charts help managers distinguish between random or routine variations in quality
and variations that they should investigate.
Cost driver A cost driver is an activity or transaction that causes costs to be incurred.
Just-in-time (JIT) method The just-in-time method manages purchasing and production so that
materials are purchased just in time for production, parts are produced just when needed for the next step in
the production process, and finished goods are completed just in time for sale.
Pareto diagrams Pareto diagrams indicate how frequently each type of failure occurs.
Total quality management (TQM) Defined as managing the entire organization so it excels in its goods
and services that are important to the customer.
Self-test
True-false
Indicate whether each of the following statements is true or false.
In Texas Instruments' cost of quality program, the managers' task was to maximize the sum of prevention,
appraisal, internal failure, and external failure costs.
Control charts are a means of distinguishing between random or routine variation in product quality and
variations that managers should investigate.
The allocation of indirect costs is never arbitrary.
A cost driver is an activity or transaction that causes costs to be incurred.
Accounting Principles: A Business Perspective 819 A Global Text