
Page 843 - Accounting Principles (A Business Perspective)
P. 843
21. Cost-volume-profit analysis
• Selling price, variable cost per unit, and total fixed costs remain constant through the relevant range. This
means that a company can sell more or fewer units at the same price and that the company has no change in
technical efficiency as volume changes.
• In multi-product situations, the product mix is known in advance.
• Costs can be accurately classified into their fixed and variable portions.
Critics may call these assumptions unrealistic in many situations, but they greatly simplify the analysis.
Using computer spreadsheets for CVP analysis
Computer spreadsheet packages are well suited for CVP analysis because they enable managers to answer what-
if questions. The cost and revenue items in CVP analysis are estimates, not actual results. Since they are used in
planning and decision making, it is reasonable to ask whether plans or decisions would change if the estimates
changed. The most important issue is whether the information is correct. The output is only as good as the
information that goes in.
Consider the following example: The management of Prince Cruises wants to know what the income before taxes
would be for a proposed product, a Caribbean cruise. The analyst prepared the following formulas for the
spreadsheet:
• Revenue equals ticket price times number of passengers (amounts to be inserted for ticket price and
number of passengers).
• Contribution margin equals (amount to be inserted) per cent of revenue.
• Fixed costs equal USD 200,000.
• Income equals revenue minus variable costs minus fixed costs.
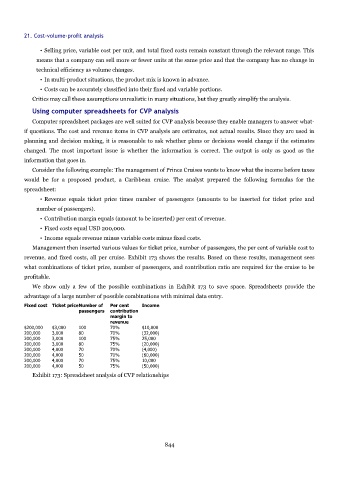
Management then inserted various values for ticket price, number of passengers, the per cent of variable cost to
revenue, and fixed costs, all per cruise. Exhibit 173 shows the results. Based on these results, management sees
what combinations of ticket price, number of passengers, and contribution ratio are required for the cruise to be
profitable.
We show only a few of the possible combinations in Exhibit 173 to save space. Spreadsheets provide the
advantage of a large number of possible combinations with minimal data entry.
Fixed cost Ticket priceNumber of Per cent Income
passengers contribution
margin to
revenue
$200,000 $3,000 100 70% $10,000
200,000 3,000 80 70% (32,000)
200,000 3,000 100 75% 25,000
200,000 3,000 80 75% (20,000)
200,000 4,000 70 70% (4,000)
200,000 4,000 50 70% (60,000)
200,000 4,000 70 75% 10,000
200,000 4,000 50 75% (50,000)
Exhibit 173: Spreadsheet analysis of CVP relationships
844