
Page 839 - Accounting Principles (A Business Perspective)
P. 839
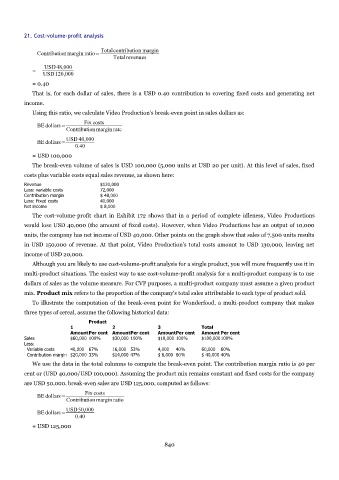
21. Cost-volume-profit analysis

                                    Totalcontribution margin
              Contribution margin ratio=
                                         Total revenues
                 USD48,000
            =
                USD120,000
            = 0.40
            That is, for each dollar of sales, there is a USD 0.40 contribution to covering fixed costs and generating net
          income.
            Using this ratio, we calculate Video Production's break-even point in sales dollars as:
                               Fix costs
              BE dollars=
                        Contribution margin rate
                        USD 40,000
              BE dollars=
                           0.40
            = USD 100,000

            The break-even volume of sales is USD 100,000 (5,000 units at USD 20 per unit). At this level of sales, fixed
          costs plus variable costs equal sales revenue, as shown here:
          Revenue                   $120,000
          Less: variable costs      72,000
          Contribution margin       $ 48,000
          Less: Fixed costs         40,000
          Net income                $ 8,000
            The cost-volume-profit chart in  Exhibit 172  shows that in a period of complete idleness, Video Productions

          would lose USD 40,000 (the amount of fixed costs). However, when Video Productions has an output of 10,000
          units, the company has net income of USD 40,000. Other points on the graph show that sales of 7,500 units results
          in USD 150,000 of revenue. At that point, Video Production's total costs amount to USD 130,000, leaving net
          income of USD 20,000.
            Although you are likely to use cost-volume-profit analysis for a single product, you will more frequently use it in
          multi-product situations. The easiest way to use cost-volume-profit analysis for a multi-product company is to use
          dollars of sales as the volume measure. For CVP purposes, a multi-product company must assume a given product

          mix. Product mix refers to the proportion of the company's total sales attributable to each type of product sold.
            To illustrate the computation of the break-even point for Wonderfood, a multi-product company that makes
          three types of cereal, assume the following historical data:
                                Product
                          1             2               3               Total
                          AmountPer cent  AmountPer cent  Amount Per cent  Amount Per cent
          Sales           $60,000 100%  $30,000 100%    $10,000 100%    $100,000100%
          Less:
            Variable costs  40,000  67%  16,000 53%     4,000  40%      60,000  60%
            Contribution margin $20,000 33%  $14,000 47%  $ 6,000 60%   $ 40,000 40%
            We use the data in the total columns to compute the break-even point. The contribution margin ratio is 40 per
          cent or (USD 40,000/USD 100,000). Assuming the product mix remains constant and fixed costs for the company
          are USD 50,000, break-even sales are USD 125,000, computed as follows:

                               Fix costs
              BE dollars=
                        Contribution margin ratio
                        USD50,000
              BEdollars=
                           0.40
            = USD 125,000


                                                           840