
Page 834 - Accounting Principles (A Business Perspective)
P. 834
This book is licensed under a Creative Commons Attribution 3.0 License
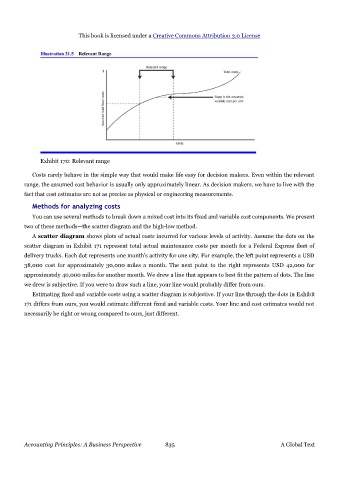
Exhibit 170: Relevant range
Costs rarely behave in the simple way that would make life easy for decision makers. Even within the relevant
range, the assumed cost behavior is usually only approximately linear. As decision makers, we have to live with the
fact that cost estimates are not as precise as physical or engineering measurements.
Methods for analyzing costs
You can use several methods to break down a mixed cost into its fixed and variable cost components. We present
two of these methods—the scatter diagram and the high-low method.
A scatter diagram shows plots of actual costs incurred for various levels of activity. Assume the dots on the
scatter diagram in Exhibit 171 represent total actual maintenance costs per month for a Federal Express fleet of
delivery trucks. Each dot represents one month's activity for one city. For example, the left point represents a USD
38,000 cost for approximately 30,000 miles a month. The next point to the right represents USD 42,000 for
approximately 40,000 miles for another month. We drew a line that appears to best fit the pattern of dots. The line
we drew is subjective. If you were to draw such a line, your line would probably differ from ours.
Estimating fixed and variable costs using a scatter diagram is subjective. If your line through the dots in Exhibit
171 differs from ours, you would estimate different fixed and variable costs. Your line and cost estimates would not
necessarily be right or wrong compared to ours, just different.
Accounting Principles: A Business Perspective 835 A Global Text