
Page 836 - Accounting Principles (A Business Perspective)
P. 836
This book is licensed under a Creative Commons Attribution 3.0 License
Now that you understand cost patterns and how to analyze costs, we will apply these concepts to the specific
tools that managers use in short-term decision making. The first of these tools is cost-volume-profit (CVP) analysis.
Cost-volume-profit (CVP) analysis
Companies use cost-volume-profit (CVP) analysis (also called break-even analysis) to determine what
affects changes in their selling prices, costs, and/or volume will have on profits in the short run. A careful and
accurate cost-volume-profit (CVP) analysis requires knowledge of costs and their fixed or variable behavior as
volume changes.
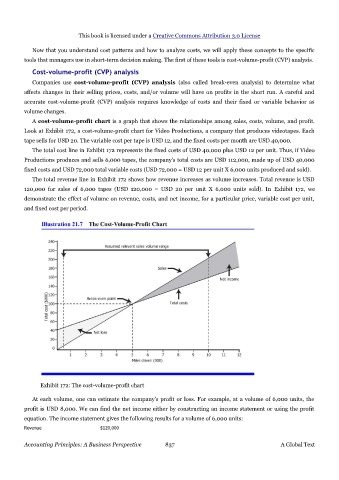
A cost-volume-profit chart is a graph that shows the relationships among sales, costs, volume, and profit.
Look at Exhibit 172, a cost-volume-profit chart for Video Productions, a company that produces videotapes. Each
tape sells for USD 20. The variable cost per tape is USD 12, and the fixed costs per month are USD 40,000.
The total cost line in Exhibit 172 represents the fixed costs of USD 40,000 plus USD 12 per unit. Thus, if Video
Productions produces and sells 6,000 tapes, the company's total costs are USD 112,000, made up of USD 40,000
fixed costs and USD 72,000 total variable costs (USD 72,000 = USD 12 per unit X 6,000 units produced and sold).
The total revenue line in Exhibit 172 shows how revenue increases as volume increases. Total revenue is USD
120,000 for sales of 6,000 tapes (USD 120,000 = USD 20 per unit X 6,000 units sold). In Exhibit 172, we
demonstrate the effect of volume on revenue, costs, and net income, for a particular price, variable cost per unit,
and fixed cost per period.
Exhibit 172: The cost-volume-profit chart
At each volume, one can estimate the company's profit or loss. For example, at a volume of 6,000 units, the
profit is USD 8,000. We can find the net income either by constructing an income statement or using the profit
equation. The income statement gives the following results for a volume of 6,000 units:
Revenue $120,000
Accounting Principles: A Business Perspective 837 A Global Text