
Page 886 - Accounting Principles (A Business Perspective)
P. 886
This book is licensed under a Creative Commons Attribution 3.0 License
The master budget illustrated
Earlier this chapter discussed general concepts relating to the preparation of a master budget. This section
illustrates the step-by-step preparation of a master budget for 2010 for Leed Company, which manufactures low-
priced running shoes.
A company develops its planned operating budget in units rather than dollars. Because revenues and many
expenses vary with volume, they can be forecasted more easily after the company estimates sales and production
quantities.
To illustrate this step, assume that Leed's management forecasts sales for the year 2010 at 100,000 units (each
pair of shoes is one unit). Quarterly sales are expected to be 20,000, 35,000, 20,000, and 25,000 units, reflecting
higher demand for shoes in the late spring and again around Christmas.
Assuming the company's policy is to stabilize production, it would produce 100,000 units uniformly throughout
the year. Therefore, production would be 25,000 units per quarter (100,000 units/four quarters). To simplify our
example, assume the company has no beginning or ending work in process inventories (although it would be
equivalent to assume that work in process inventories would remain at a constant amount throughout the year).
Finished goods inventory on 2010 January 1, is 10,000 units. From these data, we can prepare the schedule of
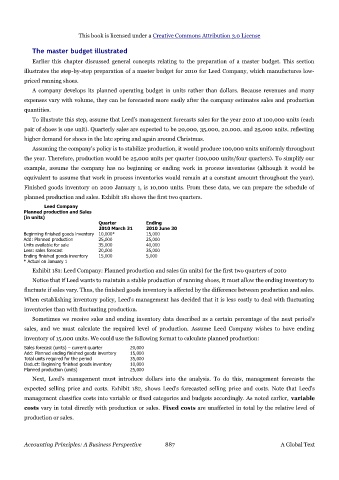
planned production and sales. Exhibit 181 shows the first two quarters.
Leed Company
Planned production and Sales
(in units)
Quarter Ending
2010 March 31 2010 June 30
Beginning finished goods inventory 10,000* 15,000
Add: Planned production 25,000 25,000
Units available for sale 35,000 40,000
Less: sales forecast 20,000 35,000
Ending finished goods inventory 15,000 5,000
* Actual on January 1
Exhibit 181: Leed Company: Planned production and sales (in units) for the first two quarters of 2010
Notice that if Leed wants to maintain a stable production of running shoes, it must allow the ending inventory to
fluctuate if sales vary. Thus, the finished goods inventory is affected by the difference between production and sales.
When establishing inventory policy, Leed's management has decided that it is less costly to deal with fluctuating
inventories than with fluctuating production.
Sometimes we receive sales and ending inventory data described as a certain percentage of the next period's
sales, and we must calculate the required level of production. Assume Leed Company wishes to have ending
inventory of 15,000 units. We could use the following format to calculate planned production:
Sales forecast (units) – current quarter 20,000
Add: Planned ending finished goods inventory 15,000
Total units required for the period 35,000
Deduct: Beginning finished goods inventory 10,000
Planned production (units) 25,000
Next, Leed's management must introduce dollars into the analysis. To do this, management forecasts the
expected selling price and costs. Exhibit 182, shows Leed's forecasted selling price and costs. Note that Leed's
management classifies costs into variable or fixed categories and budgets accordingly. As noted earlier, variable
costs vary in total directly with production or sales. Fixed costs are unaffected in total by the relative level of
production or sales.
Accounting Principles: A Business Perspective 887 A Global Text