
Page 891 - Accounting Principles (A Business Perspective)
P. 891
23. Budgeting for planning and control
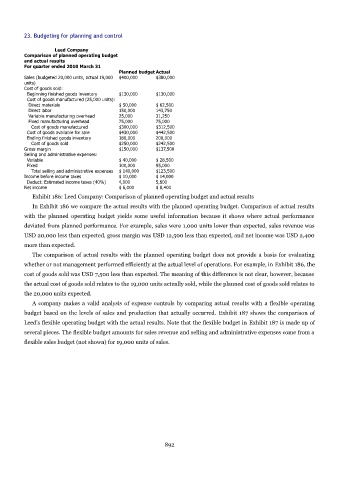
Leed Company
Comparison of planned operating budget
and actual results
For quarter ended 2010 March 31
Planned budget Actual
Sales (budgeted 20,000 units, actual 19,000 $400,000 $380,000
units)
Cost of goods sold:
Beginning finished goods inventory $130,000 $130,000
Cost of goods manufactured (25,000 units):
Direct materials $ 50,000 $ 62,500
Direct labor 150,000 143,750
Variable manufacturing overhead 25,000 31,250
Fixed manufacturing overhead 75,000 75,000
Cost of goods manufactured $300,000 $312,500
Cost of goods available for sale $430,000 $442,500
Ending finished goods inventory 180,000 200,000
Cost of goods sold $250,000 $242,500
Gross margin $150,000 $137,500
Selling and administrative expenses:
Variable $ 40,000 $ 28,500
Fixed 100,000 95,000
Total selling and administrative expenses $ 140,000 $123,500
Income before income taxes $ 10,000 $ 14,000
Deduct: Estimated income taxes (40%) 4,000 5,600
Net income $ 6,000 $ 8,400
Exhibit 186: Leed Company: Comparison of planned operating budget and actual results
In Exhibit 186 we compare the actual results with the planned operating budget. Comparison of actual results
with the planned operating budget yields some useful information because it shows where actual performance
deviated from planned performance. For example, sales were 1,000 units lower than expected, sales revenue was
USD 20,000 less than expected, gross margin was USD 12,500 less than expected, and net income was USD 2,400
more than expected.
The comparison of actual results with the planned operating budget does not provide a basis for evaluating
whether or not management performed efficiently at the actual level of operations. For example, in Exhibit 186, the
cost of goods sold was USD 7,500 less than expected. The meaning of this difference is not clear, however, because
the actual cost of goods sold relates to the 19,000 units actually sold, while the planned cost of goods sold relates to
the 20,000 units expected.
A company makes a valid analysis of expense controls by comparing actual results with a flexible operating
budget based on the levels of sales and production that actually occurred. Exhibit 187 shows the comparison of
Leed's flexible operating budget with the actual results. Note that the flexible budget in Exhibit 187 is made up of
several pieces. The flexible budget amounts for sales revenue and selling and administrative expenses come from a
flexible sales budget (not shown) for 19,000 units of sales.
892