Page 986 - Accounting Principles (A Business Perspective)
P. 986
26. Capital budgeting:Long-range planning
This calculation yields a net present value of USD 4,137, or USD 29,137 - USD 25,000. Since the net present
value is positive, the investment proposal is acceptable. However, a competing project may have an even higher net
present value.
When comparing investment projects costing different amounts, the net present value method does not provide
a valid means by which to rank the projects in order of desirability assuming limited financial resources. A
profitability index provides this additional information to management.
Profitability index
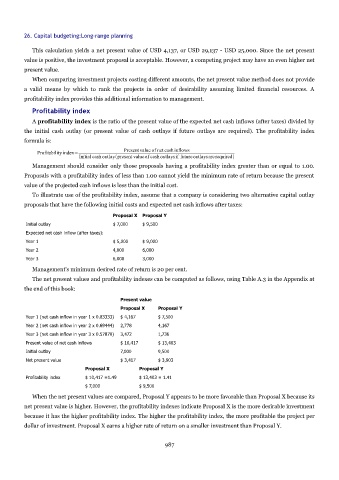
A profitability index is the ratio of the present value of the expected net cash inflows (after taxes) divided by
the initial cash outlay (or present value of cash outlays if future outlays are required). The profitability index
formula is:
Present value of net cash inflows
Profitability index=
Initial cash outlaypresent valueof cashoutlaysif futureoutlaysarerequired
Management should consider only those proposals having a profitability index greater than or equal to 1.00.
Proposals with a profitability index of less than 1.00 cannot yield the minimum rate of return because the present
value of the projected cash inflows is less than the initial cost.
To illustrate use of the profitability index, assume that a company is considering two alternative capital outlay
proposals that have the following initial costs and expected net cash inflows after taxes:
Proposal X Proposal Y
Initial outlay $ 7,000 $ 9,500
Expected net cash inflow (after taxes):
Year 1 $ 5,000 $ 9,000
Year 2 4,000 6,000
Year 3 6,000 3,000
Management's minimum desired rate of return is 20 per cent.
The net present values and profitability indexes can be computed as follows, using Table A.3 in the Appendix at
the end of this book:
Present value
Proposal X Proposal Y
Year 1 (net cash inflow in year 1 x 0.83333) $ 4,167 $ 7,500
Year 2 (net cash inflow in year 2 x 0.69444) 2,778 4,167
Year 3 (net cash inflow in year 3 x 0.57870) 3,472 1,736
Present value of net cash inflows $ 10,417 $ 13,403
Initial outlay 7,000 9,500
Net present value $ 3,417 $ 3,903
Proposal X Proposal Y
Profitability index $ 10,417 =1.49 $ 13,403 = 1.41
$ 7,000 $ 9,500
When the net present values are compared, Proposal Y appears to be more favorable than Proposal X because its
net present value is higher. However, the profitability indexes indicate Proposal X is the more desirable investment
because it has the higher profitability index. The higher the profitability index, the more profitable the project per
dollar of investment. Proposal X earns a higher rate of return on a smaller investment than Proposal Y.
987

