
Page 216 - Shaping A Sustainable Future
P. 216
Presentation of Data
Table 2 shows the estimated amount of air-conditioning,
paper, plastic wraps, lighting and water consumption
used by Shalom Movers for its daily operations on an
annual basis. Based on the information in Table 2, the
single most significant contributor to the annual CO 2
emissions, apart from the vehicle fleet, is the use of the
air-conditioner at 163,734 kgCO
2.
Eco-Solutions
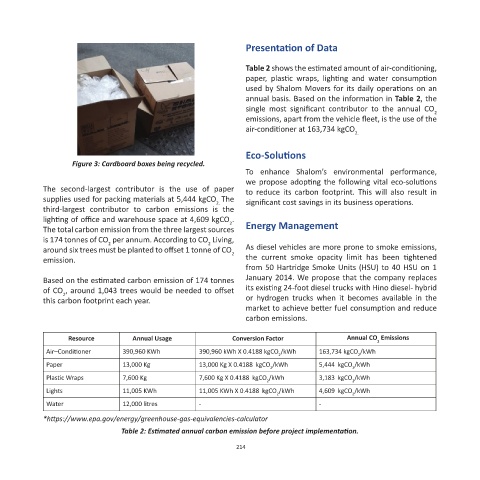
Figure 3: Cardboard boxes being recycled.
To enhance Shalom’s environmental performance,
we propose adopting the following vital eco-solutions
The second-largest contributor is the use of paper to reduce its carbon footprint. This will also result in
supplies used for packing materials at 5,444 kgCO The significant cost savings in its business operations.
2.
third-largest contributor to carbon emissions is the
lighting of office and warehouse space at 4,609 kgCO .
2
The total carbon emission from the three largest sources Energy Management
is 174 tonnes of CO per annum. According to CO Living,
2
2
around six trees must be planted to offset 1 tonne of CO As diesel vehicles are more prone to smoke emissions,
2
emission. the current smoke opacity limit has been tightened
from 50 Hartridge Smoke Units (HSU) to 40 HSU on 1
Based on the estimated carbon emission of 174 tonnes January 2014. We propose that the company replaces
of CO , around 1,043 trees would be needed to offset its existing 24-foot diesel trucks with Hino diesel- hybrid
2
this carbon footprint each year. or hydrogen trucks when it becomes available in the
market to achieve better fuel consumption and reduce
carbon emissions.
Resource Annual Usage Conversion Factor Annual CO Emissions
2
Air–Conditioner 390,960 KWh 390,960 kWh X 0.4188 kgCO /kWh 163,734 kgCO /kWh
2 2
Paper 13,000 Kg 13,000 Kg X 0.4188 kgCO /kWh 5,444 kgCO /kWh
2 2
Plastic Wraps 7,600 Kg 7,600 Kg X 0.4188 kgCO /kWh 3,183 kgCO /kWh
2 2
Lights 11,005 KWh 11,005 KWh X 0.4188 kgCO /kWh 4,609 kgCO /kWh
2 2
Water 12,000 litres - -
*https://www.epa.gov/energy/greenhouse-gas-equivalencies-calculator
Table 2: Estimated annual carbon emission before project implementation.
214