
Page 10 - Ranger Demo
P. 10
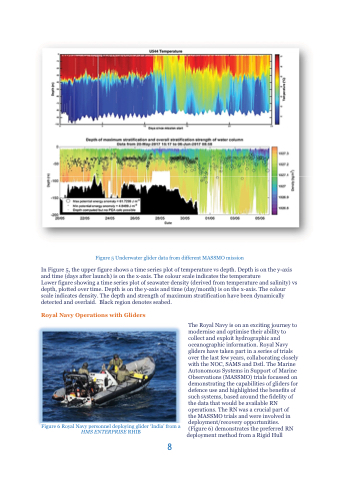
Figure 5 Underwater glider data from different MASSMO mission
In Figure 5, the upper figure shows a time series plot of temperature vs depth. Depth is on the y-axis and time (days after launch) is on the x-axis. The colour scale indicates the temperature
Lower figure showing a time series plot of seawater density (derived from temperature and salinity) vs depth, plotted over time. Depth is on the y-axis and time (day/month) is on the x-axis. The colour scale indicates density. The depth and strength of maximum stratification have been dynamically detected and overlaid. Black region denotes seabed.
Royal Navy Operations with Gliders
The Royal Navy is on an exciting journey to modernise and optimise their ability to collect and exploit hydrographic and oceanographic information. Royal Navy gliders have taken part in a series of trials over the last few years, collaborating closely with the NOC, SAMS and Dstl. The Marine Autonomous Systems in Support of Marine Observations (MASSMO) trials focussed on demonstrating the capabilities of gliders for defence use and highlighted the benefits of such systems, based around the fidelity of the data that would be available RN operations. The RN was a crucial part of the MASSMO trials and were involved in deployment/recovery opportunities. (Figure 6) demonstrates the preferred RN
deployment method from a Rigid Hull
Figure 6 Royal Navy personnel deploying glider ‘India’ from a HMS ENTERPRISE RHIB
8
