Page 7 - CECA Benchmarking - Summary Report (Apr'21 to Jan'22 incl.)_Updated Logos
P. 7

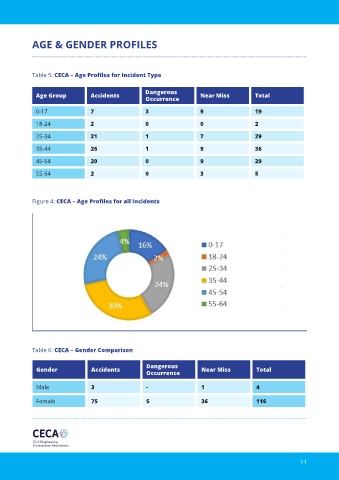
AGE & GENDER PROFILES


            Table 5: CECA – Age Profiles for Incident Type

                                                    Dangerous
              Age Group          Accidents                             Near Miss           Total
                                                    Occurrence

              0-17               7                  3                  9                   19
              18-24              2                  0                  0                   2

              25-34              21                 1                  7                   29

              35-44              26                 1                  9                   36
              45-54              20                 0                  9                   29

              55-64              2                  0                  3                   5


            Figure 4: CECA – Age Profiles for all Incidents


            Table 6: CECA – Gender Comparison

                                                    Dangerous
              Gender             Accidents                              Near Miss          Total
                                                    Occurrence

              Male               3                  -                   1                  4

              Female             75                 5                   36                 116


                                                                                                          11
   2   3   4   5   6   7   8