
Page 122 - 2017academicreport
P. 122
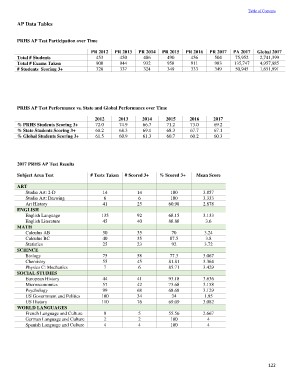
Table of Contents

AP Data Tables

PRHS AP Test Participation over Time

Total # Students                   PR 2012  PR 2013  PR 2014   PR 2015      PR 2016  PR 2017  PA 2017  Global 2017
Total # Exams Taken                   453      450      486       490          456      504    75,952   2,741,399
# Students Scoring 3+                 900      944      932       958          911      983   135,747   4,957,885
                                      326      337      324       349          333      349    50,945   1,651,991

PRHS AP Test Performance vs. State and Global Performance over Time

% PRHS Students Scoring 3+         2012     2013         2014  2015         2016     2017
% State Students Scoring 3+        72.0     74.9         66.7  71.2         73.0     69.2
% Global Students Scoring 3+       68.2     68.3         69.1  68.3         67.7     67.1
                                   61.5     60.9         61.3  60.7         60.2     60.3

2017 PRHS AP Test Results

Subject Area Test                  # Tests Taken # Scored 3+   % Scored 3+  Mean Score

ART                                   14             14               100       3.857
     Studio Art: 2-D                   6             6                100       3.333
     Studio Art: Drawing              41             25             60.98       2.878
     Art History
                                      135            92             68.15       3.133
ENGLISH                               45             40             88.88        3.6
     English Language
     English Literature               50             35               70         3.24
                                      40             35              87.5        3.8
MATH                                  25             23               92         3.72
     Calculus AB
     Calculus BC                      75             58              77.3       3.067
     Statistics                       55             45             81.81       3.364
                                       7             6              85.71       3.429
SCIENCE
     Biology                          44             41             93.18       3.636
     Chemistry                        57             42             73.68       3.158
     Physics C: Mechanics             99             68             68.68       3.129
                                      100            34                          1.95
SOCIAL STUDIES                        110            76               34        3.082
     European History                                               69.09
     Microeconomics                    9             5                          2.667
     Psychology                        2             2              55.56         4
     US Government and Politics        4             4                100         4
     US History                                                       100

WORLD LANGUAGES
     French Language and Culture
     German Language and Culture
     Spanish Language and Culture

                                                                                                       122