
Page 119 - 2017academicreport
P. 119
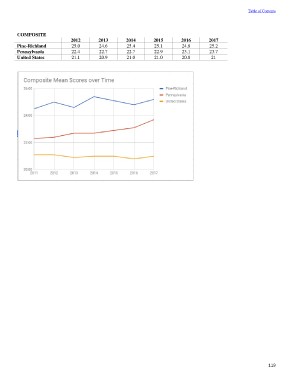
Table of Contents

COMPOSITE      2012  2013  2014  2015  2016  2017
               25.0  24.6  25.4  25.1  24.8  25.2
Pine-Richland  22.4  22.7  22.7  22.9  23.1  23.7
Pennsylvania   21.1  20.9  21.0  21.0  20.8   21
United States

                                                   119