
Page 116 - 2017academicreport
P. 116
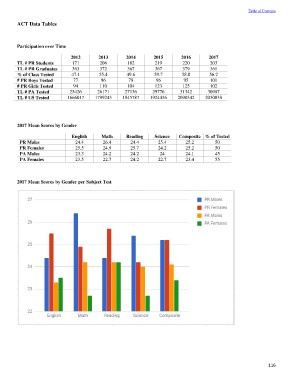
Table of Contents

ACT Data Tables

Participation over Time

TL # PR Students           2012     2013       2014     2015     2016       2017
TL # PR Graduates           171      206        182      219      220        203
% of Class Tested           363      372        367      367      379        361
# PR Boys Tested           47.1     55.4       49.6     59.7     58.0       56.2
# PR Girls Tested           77       96         78       96       95         101
TL # PA Tested              94       110        104      123      125        102
TL # US Tested            25426    26171      27136    29776    31342      30987
                         1666017  1799243    1845787  1924436  2090342    2030038

2017 Mean Scores by Gender

PR Males                 English  Math       Reading  Science  Composite  % of Tested
PR Females                 24.4   26.4         24.4     25.4       25.2         50
PA Males                   25.5   24.9         25.7     24.2       25.2         50
PA Females                 23.3   24.2         24.2      24        24.1         45
                           23.5   22.7         24.2     22.7       23.4         55

2017 Mean Scores by Gender per Subject Test

                                                                                       116