
Page 113 - 2017academicreport
P. 113
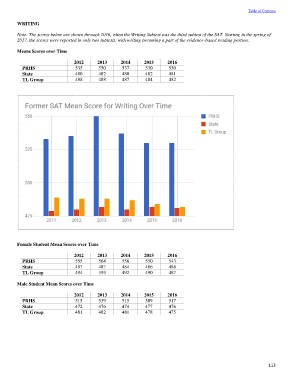
Table of Contents

WRITING

Note: The scores below are shown through 2016, when the Writing Subtest was the third subtest of the SAT. Starting in the spring of
2017, the scores were reported in only two subtests, with writing becoming a part of the evidence-based reading portion.

Means Scores over Time

PRHS                    2012        2013  2014  2015  2016
State                   535         550   537   530   530
TL Group                480         482   480   482   481
                        488         488   487   484   482

Female Student Mean Scores over Time

PRHS                    2012        2013  2014  2015  2016
State                   555         564   556   550   543
TL Group                487         487   484   486   486
                        494         493   492   490   487

Male Student Mean Scores over Time        2014  2015  2016
                                          515   509   517
PRHS                    2012        2013  474   477   476
State                   515         539   481   478   475
TL Group                472         476
                        481         482

                                                            113