
Page 109 - 2017academicreport
P. 109
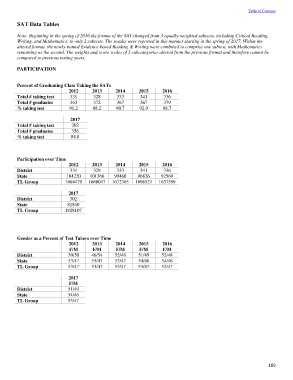
Table of Contents

SAT Data Tables

Note: Beginning in the spring of 2016 the format of the SAT changed from 3 equally-weighted subtests, including Critical Reading,
Writing, and Mathematics, to only 2 subtests. The results were reported in this manner starting in the spring of 2017. Within the
altered format, the newly-named Evidence-based Reading & Writing were combined to comprise one subtest, with Mathematics
remaining as the second. The weights and score scales of 2 subcategories altered from the previous format and therefore cannot be
compared to previous testing years.

PARTICIPATION

Percent of Graduating Class Taking the SATs

                         2012    2013         2014     2015     2016
                                              333      341      336
Total # taking test 331 328                   367      367      379
                                              90.7     92.9     88.7
Total # graduates        363 372

% taking test            91.2 88.2

Total # taking test      2017
Total # graduates        302
% taking test            356
                         84.8

Participation over Time

                         2012      2013         2014     2015     2016
                                    328          333      341      336
District                 331     101368        99460    96826    92569
                                 1660047      1672365  1698521  1637589
State                    104220

TL Group             1664479

District               2017
State                   302
TL Group              81840
                     1828107

Gender as a Percent of Test Takers over Time

                         2012    2013         2014     2015     2016
                                                       F/M      F/M
                         F/M F/M F/M                   51/49    52/48
                                                       54/46    54/46
District                 50/50   46/54        52/48    53/47    53/47

State                    53/47   53/47        53/47

TL Group                 53/47   53/47        53/47

District                 2017
State                    F/M
TL Group                 51/49
                         54/46
                         53/47

                                                                         109